Comparative Study
. 2018 Jun 13;3(3):e00219-18.
doi: 10.1128/mSphere.00219-18.

Rectal and Naris Swabs: Practical and Informative Samples for Analyzing the Microbiota of Critically Ill Patients

Affiliations
Comparative Study

Rectal and Naris Swabs: Practical and Informative Samples for Analyzing the Microbiota of Critically Ill Patients

Saumya Bansal et al. mSphere. .

Erratum in

Abstract

Commensal microbiota are immunomodulatory, and their pathological perturbation can affect the risk and outcomes of infectious and inflammatory diseases. Consequently, the human microbiota is an emerging diagnostic and therapeutic target in critical illness. In this study, we compared four sample types-rectal, naris, and antecubital swabs and stool samples-for 16S rRNA gene microbiota sequencing in intensive care unit (ICU) patients. Stool samples were obtained in only 31% of daily attempts, while swabs were reliably obtained (≥97% of attempts). Swabs were compositionally distinct by anatomical site, and rectal swabs identified within-patient temporal trends in microbiota composition. Rectal swabs from ICU patients demonstrated differences from healthy stool similar to those observed in comparing stool samples from ICU patients to those from the same healthy controls. Rectal swabs are a useful complement to other sample types for analysis of the intestinal microbiota in critical illness, particularly when obtaining stool may not be feasible or practical.IMPORTANCE Perturbation of the microbiome has been correlated with various infectious and inflammatory diseases and is common in critically ill patients. Stool is typically used to sample the microbiota in human observational studies; however, it is often unavailable for collection from critically ill patients, reducing its utility as a sample type to study this population. Our research identified alternatives to stool for sampling the microbiota during critical illness. Rectal and naris swabs were practical alternatives for use in these patients, as they were observed to be more reliably obtained than stool, were suitable for culture-independent analysis, and successfully captured within- and between-patient microbiota differences.

Keywords: 16S RNA; critical illness; human microbiome.


Figures

FIG 1
FIG 1
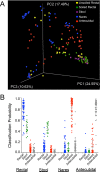
(A) Bray-Curtis principal-coordinate analysis (PCoA) of naris, antecubital, and rectal swabs and stool samples from ICU patients. Bray-Curtis intersample distances were calculated using relative abundance data from taxa representing more than 0.1% of the total population. Axis percentages indicate proportions of the overall variance explained. (B) Classification probabilities (y axis) were generated using the script supervised_learning.py (available on QIIME version 1.9.1) and the microbiota composition of each sample type (shown underlined below the x axis) as the predictor of the assignment. A high classification probability indicates compositional similarity between the sample and the specified sample type. Data points represent individual samples with means (horizontal line) and standard deviations (error bars).
FIG 2
FIG 2
Bray-Curtis principal-coordinate analysis (PCoA) of healthy stool (American Gut Project [AGP] study no. PRJEB11425), stool from ICU patients (from the study by McDonald et al. [4] and the present study), rectal swabs from ICU patients (from the present study), oral and skin samples from ICU patients (from the study by McDonald et al. [4]). Axis percentages indicate proportions of the overall variance explained.
FIG 3
FIG 3
Comparison of taxonomic differences between stool microbiota from healthy patients and stool microbiota from ICU patients and stool from healthy patients and rectal swabs from ICU patients. ANCOM W-statistics were generated for taxa shared between three data sets. The x axis presents results of comparisons of stool from healthy volunteers in the American Gut Project (AGP) and stool samples from ICU patients (from the study by McDonald et al. [4] and the present study). The y axis presents results of comparisons of stool from the same healthy volunteers with rectal swabs from ICU patients (from the present study). Groups 1 and 3 represent taxa that were discordant between these two comparisons. Taxa that were below the significance level in ANCOM but were still seen to cluster with groups 1 and 3 were included at an arbitrary W statistic value of above 150 and are indicated in the dotted circles. Taxa in these dotted circles form the basis of analysis in Fig. 4 (see also Fig. S2 and S3).
FIG 4
FIG 4
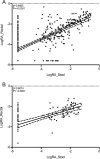
Correlations between logarithmic relative abundance data in paired rectal swabs and stool samples from the present study (matched by patient and day and time of collection) for “discordant” taxa from Fig. 3. (A) Taxa differentially abundant only between stool from healthy volunteers and stool from ICU patients (group 1 in Fig. 3). (B) Taxa differentially abundant only between rectal swabs from ICU patients and stool from healthy volunteers (group 3 in Fig. 3). The Spearman’s correlation coefficient (ρ) value and P value for significant results are shown (****, P < 0.0001).
FIG 5
FIG 5
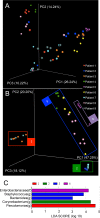
PCoA of Bray-Curtis dissimilarity of sequential daily samples from 9 patients. (A) Rectal swabs. (B) Naris swabs. The colored boxes labeled 1 to 4 represent the sample groups used for LEfSe analysis shown in Fig. 2C. Markers represent sequential daily samples colored according study subject. Bray-Curtis intersample distances were calculated using relative abundance data from taxa representing more than 0.1% of the total population. Axis percentages indicate proportions of the overall variance explained. (C) Taxa identified through LEfSe analysis as primary drivers of differences in microbiota composition between groups 1 to 4 shown in Fig. 5B. f, family; g, genus; LDA, linear discriminant analysis.
FIG 6
FIG 6
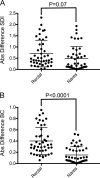
Absolute (Abs) differences in Shannon diversity index (SDI) values (A) and Bray-Curtis (BC) dissimilarity index values (B) between sequential daily rectal and naris samples in each patient. Data points represent sequential sample comparisons with means and standard deviations (solid horizontal line and error bars). P values for pairwise Wilcoxon matched-pair signed-rank tests are shown.
FIG 7
FIG 7
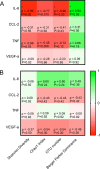
Heat maps summarizing Spearman correlations between log10-transformed cytokine levels (log IL-6, CCL-2, TNF, and VEGF-A [in picograms/milliliter]) in blood plasma and composite measures of alpha-diversity (Shannon diversity index, Chao1 index, OTU number, Berger-Parker dominance value) in day 1 rectal (A) and naris (B) swabs from 6 study subjects for whom blood samples were available. Green indicates a positive correlation, and red indicates a negative correlation. The shade of the color represents the strength of the correlation, with lighter shades indicating a weaker correlation. The Spearman’s correlation coefficient (ρ) value and P value for significant results are shown (*, P < 0.05; **, P < 0.01; ***, P < 0.001; ****, P < 0.0001).

Similar articles

Cited by

References

    1. Baquero F, Nombela C. 2012. The microbiome as a human organ. Clin Microbiol Infect 18(Suppl 4):2–4. doi: 10.1111/j.1469-0691.2012.03916.x. - DOI - PubMed
    1. Cho I, Blaser MJ. 2012. The human microbiome: at the interface of health and disease. Nat Rev Genet 13:260–270. doi: 10.1038/nrg3182. - DOI - PMC - PubMed
    1. Vincent J-L, Rello J, Marshall J, Silva E, Anzueto A, Martin CD, Moreno R, Lipman J, Gomersall C, Sakr Y, Reinhart K; EPIC II Group of Investigators . 2009. International study of the prevalence and outcomes of infection in intensive care units. JAMA 302:2323. doi: 10.1001/jama.2009.1754. - DOI - PubMed
    1. McDonald D, Ackermann G, Khailova L, Baird C, Heyland D, Kozar R, Lemieux M, Derenski K, King J, Vis-Kampen C, Knight R, Wischmeyer PE. 2016. Extreme dysbiosis of the microbiome in critical illness. mSphere 1:e00199-16. doi: 10.1128/mSphere.00199-16. - DOI - PMC - PubMed
    1. Lankelma JM, van Vught LA, Belzer C, Schultz MJ, van der Poll T, de Vos WM, Wiersinga WJ. 2017. Critically ill patients demonstrate large interpersonal variation in intestinal microbiota dysregulation: a pilot study. Intensive Care Med 43:59–68. doi: 10.1007/s00134-016-4613-z. - DOI - PMC - PubMed

Publication types

Grants and funding

LinkOut - more resources