

Age Correlates with Response to Anti-PD1, Reflecting Age-Related Differences in Intratumoral Effector and Regulatory T-Cell Populations
- PMID: 29898988
- PMCID: PMC6324578
- DOI: 10.1158/1078-0432.CCR-18-1116
Age Correlates with Response to Anti-PD1, Reflecting Age-Related Differences in Intratumoral Effector and Regulatory T-Cell Populations
Abstract
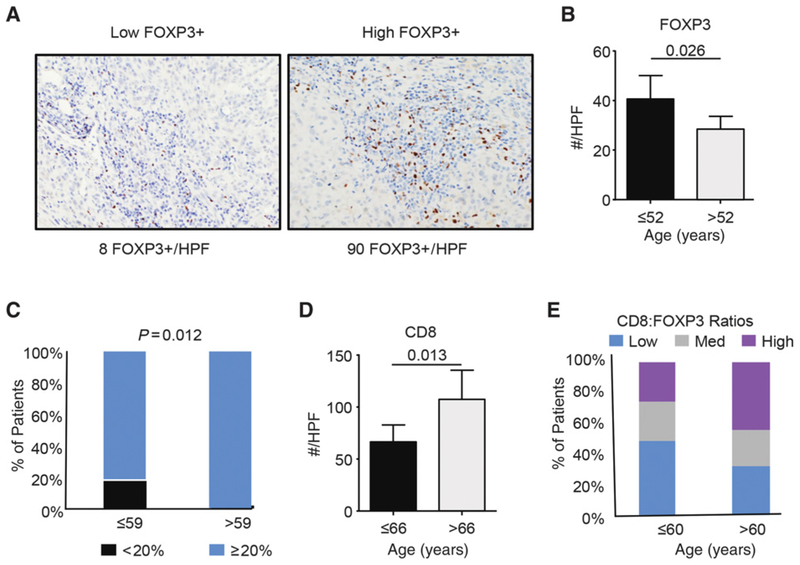
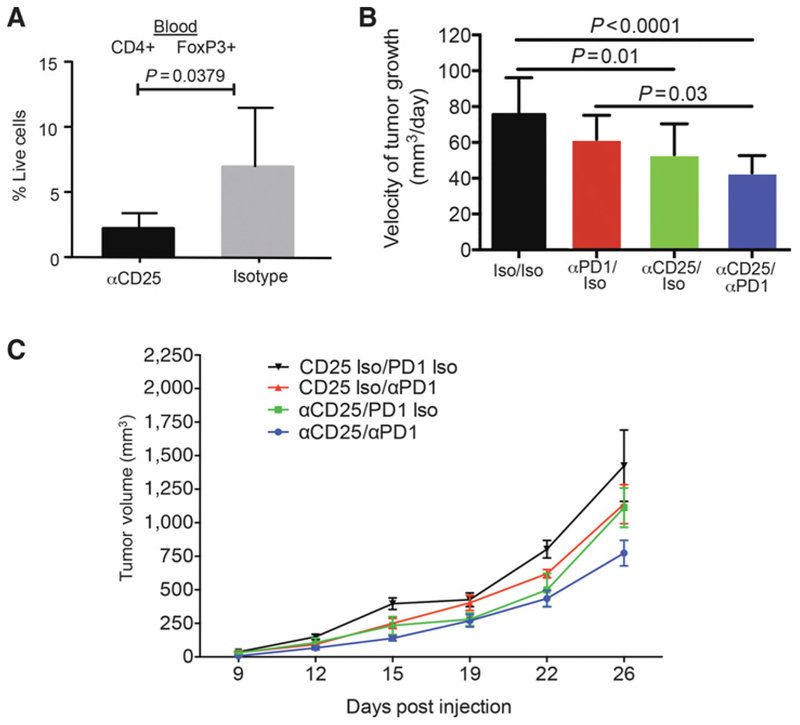
Purpose: We have shown that the aged microenvironment increases melanoma metastasis, and decreases response to targeted therapy, and here we queried response to anti-PD1.Experimental Design: We analyzed the relationship between age, response to anti-PD1, and prior therapy in 538 patients. We used mouse models of melanoma, to analyze the intratumoral immune microenvironment in young versus aged mice and confirmed our findings in human melanoma biopsies.Results: Patients over the age of 60 responded more efficiently to anti-PD-1, and likelihood of response to anti-PD-1 increased with age, even when we controlled for prior MAPKi therapy. Placing genetically identical tumors in aged mice (52 weeks) significantly increased their response to anti-PD1 as compared with the same tumors in young mice (8 weeks). These data suggest that this increased response in aged patients occurs even in the absence of a more complex mutational landscape. Next, we found that young mice had a significantly higher population of regulatory T cells (Tregs), skewing the CD8+:Treg ratio. FOXP3 staining of human melanoma biopsies revealed similar increases in Tregs in young patients. Depletion of Tregs using anti-CD25 increased the response to anti-PD1 in young mice.Conclusions: While there are obvious limitations to our study, including our inability to conduct a meta-analysis due to a lack of available data, and our inability to control for mutational burden, there is a remarkable consistency in these data from over 500 patients across 8 different institutes worldwide. These results stress the importance of considering age as a factor for immunotherapy response. Clin Cancer Res; 24(21); 5347-56. ©2018 AACR See related commentary by Pawelec, p. 5193.
©2018 American Association for Cancer Research.
Conflict of interest statement
Disclosure of Potential Conflicts of Interest
J.A. Sosman is a consultant/advisory board member for Bristol–Myers Squibb and Genentech. M.S. Carlino is a consultant/advisory board member for Bristol, Myers, Squibb, MSD, Novartis, and Amgen. G.V. Long is a consultant/advisory board member for MSD; Bristol, Myers, Squibb; Novartis; Roche; Amgen; Array; and Pierre Fabre. A. Ribas is a consultant/advisory board member for Merck and Bristol, Myers, Squibb. Z. Eroglu is a consultant/advisory board member for Compugen. M.A. Davies reports receiving commercial research grants from Roche/Genentech, AstraZeneca, GlaxoSmithKline, Sanofi-Aventis, Myriad, and Ocothyreon, and is a consultant/advisory board member for Novartis; Bristol, Myers, Squibb; Roche/Genentech; GlaxoSmithKline; Sanofi-Aventis; Vaccinex; and Syndax. A.M. Menzies is a consultant/advisory board member for Bristol, Myers, Squibb; MSD; Novartis; Roche; and Pierre-Fabre. D.B. Johnson reports receiving commercial research grants from Incyte, reports receiving other commercial research support from Bristol, Myers, Squibb, and is a consultant/advisory board member for Array, Bristol–Myers Squibb, Incyte, and Merck. No potential conflicts of interest were disclosed by the other authors.
Figures


Comment in
-
Unexpected Benefits of Aging for Favorable Responses to PD-1 Blockade in Melanoma?Clin Cancer Res. 2018 Nov 1;24(21):5193-5194. doi: 10.1158/1078-0432.CCR-18-1475. Epub 2018 Jun 15. Clin Cancer Res. 2018. PMID: 29907623
-
Older melanoma patients may respond better to anti-PD1 immunotherapy.Cancer. 2018 Oct 15;124(20):3961. doi: 10.1002/cncr.31794. Cancer. 2018. PMID: 30422326 No abstract available.
References
Publication types
MeSH terms
Substances
Grants and funding
- P30 CA010815/CA/NCI NIH HHS/United States
- P01 CA114046/CA/NCI NIH HHS/United States
- R01 CA174746/CA/NCI NIH HHS/United States
- P50 CA174523/CA/NCI NIH HHS/United States
- T32 AR064184/AR/NIAMS NIH HHS/United States
- T32 CA009171/CA/NCI NIH HHS/United States
- 22902/CRUK_/Cancer Research UK/United Kingdom
- K23 CA204726/CA/NCI NIH HHS/United States
- T32 CA009666/CA/NCI NIH HHS/United States
- P50 CA168536/CA/NCI NIH HHS/United States
- 17240/CRUK_/Cancer Research UK/United Kingdom
- P50 CA093372/CA/NCI NIH HHS/United States
- K12 CA090625/CA/NCI NIH HHS/United States
- K99 CA208012/CA/NCI NIH HHS/United States
- 19279/CRUK_/Cancer Research UK/United Kingdom
- R01 CA207935/CA/NCI NIH HHS/United States
LinkOut - more resources
Full Text Sources
Other Literature Sources
Research Materials
