. 2018 Aug 6;150(8):1163-1177.
doi: 10.1085/jgp.201812035. Epub 2018 Jun 13.

Tracking the sarcoplasmic reticulum membrane voltage in muscle with a FRET biosensor

Affiliations

Tracking the sarcoplasmic reticulum membrane voltage in muscle with a FRET biosensor

Colline Sanchez et al. J Gen Physiol. .

Abstract

Ion channel activity in the plasma membrane of living cells generates voltage changes that are critical for numerous biological functions. The membrane of the endoplasmic/sarcoplasmic reticulum (ER/SR) is also endowed with ion channels, but whether changes in its voltage occur during cellular activity has remained ambiguous. This issue is critical for cell functions that depend on a Ca2+ flux across the reticulum membrane. This is the case for contraction of striated muscle, which is triggered by opening of ryanodine receptor Ca2+ release channels in the SR membrane in response to depolarization of the transverse invaginations of the plasma membrane (the t-tubules). Here, we use targeted expression of voltage-sensitive fluorescence resonance energy transfer (FRET) probes of the Mermaid family in differentiated muscle fibers to determine whether changes in SR membrane voltage occur during depolarization-contraction coupling. In the absence of an SR targeting sequence, FRET signals from probes present in the t-tubule membrane allow calibration of the voltage sensitivity and amplitude of the response to voltage-clamp pulses. Successful SR targeting of the probes was achieved using an N-terminal domain of triadin, which completely eliminates voltage-clamp-activated FRET signals from the t-tubule membrane of transfected fibers. In fibers expressing SR-targeted Mermaid probes, activation of SR Ca2+ release in the presence of intracellular ethyleneglycol-bis(β-amino-ethyl ether)-N,N,N',N'-tetra acetic acid (EGTA) results in an accompanying FRET signal. We find that this signal results from pH sensitivity of the probe, which detects cytosolic acidification because of the release of protons upon Ca2+ binding to EGTA. When EGTA is substituted with either 1,2-bis(o-aminophenoxy)ethane-N,N,N',N'-tetraacetic acid or the contraction blocker N-benzyl-p-toluene sulfonamide, we find no indication of a substantial change in the FRET response caused by a voltage change. These results suggest that the ryanodine receptor-mediated SR Ca2+ efflux is well balanced by concomitant counterion currents across the SR membrane.


Figures

Figure 1.
Figure 1.
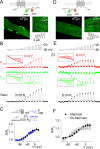
Detection of t-tubule voltage changes with Mermaid and Rv-Mermaid in muscle fibers. (A and D) Confocal pattern of the green fluorescence in muscle fibers expressing Mermaid and Rv-Mermaid, respectively. In each panel, the frame and graph on the right show a higher-magnification view together with the longitudinal profile of fluorescence within the white box. Expression of Mermaid and Rv-Mermaid yielded a transverse-banded pattern consistent with the proteins being present in the triadic region of the fibers. A schematic illustration of the structure of the proteins is shown at top. (B and E) Changes in mUKG (F500, green) and mKOκ (F>560, red) fluorescence and corresponding FRET ratio in response to the voltage-clamp protocol shown at top, from muscle fibers expressing Mermaid and Rv-Mermaid, respectively. In response to the voltage-clamp depolarizing steps from −80 mV, the detected changes in fluorescence (at 500 nm and >560 nm, upon 458-nm excitation) were consistent with voltage-dependent energy transfer between the two fluorophores mUKG and mKOκ, providing evidence for localization of Mermaid and Rv-Mermaid in the t-tubule membrane of the muscle fibers. Main traces in B and E have been corrected from time-dependent changes in fluorescence also observed when no voltage pulse was given. Raw fluorescence traces and superimposed fits used for the correction are shown in the insets. Details of how fits were generated and correction performed are described in Materials and methods. (C) Changes in Mermaid FRET ratio in response to depolarizing (left, black trace) and hyperpolarizing (right, blue trace) steps from −80 and 0 mV, respectively, in the same fiber. The graph at bottom shows the mean voltage dependence of the change in FRET ratio established from three fibers stimulated with a series of successive voltage-clamp depolarizing steps from −80 mV (black circles) and then with a series of successive hyperpolarizing steps from 0 mV (blue circles). FRET ratio values were normalized to the value R0 at −80 mV. Step hyperpolarizing pulses from 0 mV generated symmetrical changes in the FRET ratio, with no detectable sign of shift in the voltage sensitivity. (F) Mean voltage dependence of the FRET response of Mermaid (n = 6) and Rv-Mermaid (n = 6) established using depolarizing steps from −80 mV. Error bars represent ± SEM.
Figure 2.
Figure 2.
FRET response of Rv-MermaidD129E/Y235R to changes in t-tubule membrane voltage applied from 0 mV. (A) Schematic structure of Rv-MermaidD129E/Y235R and its confocal triadic pattern in muscle fibers. (B) Changes in mUKG (F500, green) and mKOκ (F>560, red) fluorescence in response to the indicated voltage protocol. Insets show the corresponding raw records before correction for voltage-independent changes in fluorescence; the fit used for correction is shown in white. (C) Changes in the FRET ratio (F>560/F500) elicited in response to the pulse protocols shown at top. The black trace was from the fluorescent responses shown in B. (D) Mean voltage dependence of the FRET response measured with voltage pulses from 0 mV (n = 6). FRET ratio values were normalized to the value at 0 mV (R0). (E) Mean voltage dependence of the time constant of change in FRET ratio at the onset (τon) and offset (τoff) of the pulses. Error bars represent ± SEM.
Figure 3.
Figure 3.
Complex response of Rv-MermaidD129E/Y235R to t-tubule membrane depolarization from −80 mV. (A) Schematic structure of Rv-MermaidD129E/Y235R and the changes in mUKG and mKOκ fluorescence in response to the indicated voltage-clamp pulse protocol. Insets show the corresponding raw records before correction for voltage-independent changes in fluorescence; the fit used for correction is shown in white. (B) FRET ratio calculated from the fluorescent traces shown in A. (C) Voltage dependence of the end-pulse FRET ratio measured in response to the pulse protocol shown in A and B. Datasets are from seven muscle fibers, six of which were the ones used to generate mean values shown in Fig. 2 D. (D) Asymmetrical response to a depolarization from −80 mV compared with a hyperpolarization from 0 mV. Left: The FRET ratio (bottom trace) was measured in response to the pulse protocol shown at top. The pink portions of traces were synchronized and summed to produce the pink trace on the right.
Figure 4.
Figure 4.
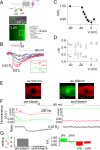
FRET response of T306-Rv-MermaidD129E/Y235R during Ca2+ release. (A) Patchy expression (regions pointed by green arrows) and triadic confocal pattern (bottom image and associated graph showing the longitudinal fluorescence profile along the white box) of T306-Rv-MermaidD129E/Y235R in muscle fibers. Schematic structure of the protein is shown at top. (B) Changes in T306-Rv-MermaidD129E/Y235R FRET ratio in response to the indicated voltage-clamp depolarizing pulses. Inset shows the fluorescent traces in response to the pulse from −80 to −10 mV. (C) Mean voltage dependence of the peak amplitude of the drop in FRET ratio measured in response to single 0.5-s-long pulses from −80 mV. For this, successive single depolarizing pulses of increasing amplitude were applied, separated by a time interval of 30 s. Data points are mean values from several fibers ranging from a minimum of seven and a maximum of 13. (D) Mean voltage dependence of the time constant of change in FRET ratio at the onset (τon) of the depolarizing pulses and upon return (τoff) to the holding value of −80 mV. (E) Acceptor photobleaching of the resting fluorescence from a fiber expressing Rv-MermaidD129E/Y235R: x,y fluorescence frames after photobleaching of a square region in the middle of the fiber with excitation light at 543 nm. Bar, 20 µm. (F) Effect of acceptor photobleaching (postbleach) on the changes in fluorescence detected in response to a depolarizing pulse from −80 to 0 mV in FRET configuration (458-nm excitation) from a fiber expressing T306-Rv-MermaidD129E/Y235R. (G) Mean values for the resting fluorescence ratio (left) and the relative changes in F500 and F>560 fluorescence (right) triggered by a strong depolarizing pulse, from five fibers expressing T306-Rv-MermaidD129E/Y235R. Error bars represent ± SEM.
Figure 5.
Figure 5.
FRET response of T306-Rv-Mermaid during Ca2+ release. (A) Patchy expression and triadic confocal pattern (bottom image and associated trace showing the longitudinal fluorescence profile along the white box) of T306-Rv-Mermaid in muscle fibers. (B) Changes in T306-Rv-Mermaid FRET ratio in response to the indicated voltage-clamp depolarizing pulses. (C) Mean voltage dependence of the peak amplitude of the drop in FRET ratio measured in response to single 0.5-s-long pulses from −80 mV. For this, successive single depolarizing pulses of increasing amplitude were applied, separated by a time interval of 30 s. Data points are mean values from six fibers. Error bars represent ± SEM.
Figure 6.
Figure 6.
pH sensitivity of the FRET response from T306-Rv-Mermaid during Ca2+ release. (A) Changes in fluorescence and in the corresponding FRET ratio in response to extracellular changes in pH in the presence of nigericin, in a muscle fiber expressing T306-Rv-MermaidD129E/Y235R. (B) Change in FRET ratio from five nigericin-treated muscle fibers expressing T306-Rv-MermaidD129E/Y235R, upon changes in pH. Each symbol corresponds to a different fiber. The continuous line shows the result from fitting a Hill equation to the data shown as triangles, inverted triangles, and diamonds.
Figure 7.
Figure 7.
FRET response of T306-Rv-MermaidD129E/Y235R and T306-Rv-Mermaid during Ca2+ release in the absence of intracellular EGTA. (A) FRET response to 0.5-s-long voltage-clamp depolarizing pulses to values ranging between −30 and +10 mV from a muscle fiber expressing T306-Rv-MermaidD129E/Y235R, equilibrated in the presence of intracellular BAPTA. The inset shows the mean response from four fibers to large depolarizing pulses in the same condition (see text for details). Successive single depolarizing pulses were separated by a time interval of 30 s. (B) Mean rhod-2 cytosolic Ca2+ transient elicited by a depolarizing pulse from −80 to +40 mV in seven fibers equilibrated with intracellular EGTA (black trace) and four fibers equilibrated with intracellular BAPTA (red trace). Gray shading corresponds to SEM. (C) FRET response to 0.5-s-long depolarizing voltage-clamp pulses to −35, −30, and −20 mV from a muscle fiber expressing T306-Rv-MermaidD129E/Y235R in the presence of extracellular BTS. Successive single depolarizing pulses were separated by 30 s. (D) FRET response of a muscle fiber expressing T306-Rv-MermaidD129E/Y235R, equilibrated with intracellular EGTA, to a train of action potentials generated at 100 Hz. (E) FRET response of a muscle fiber expressing T306-Rv-MermaidD129E/Y235R, equilibrated without intracellular EGTA and in the presence of extracellular BTS, to a train of action potentials generated at 20 Hz. (F) FRET response of a fiber expressing T306-Rv-Mermaid, equilibrated without intracellular EGTA and in the presence of extracellular BTS, to a train of action potentials at 100 Hz.

Comment in

Similar articles

Cited by

References

    1. Abramcheck C.W., and Best P.M.. 1989. Physiological role and selectivity of the in situ potassium channel of the sarcoplasmic reticulum in skinned frog skeletal muscle fibers. J. Gen. Physiol. 93:1–21. 10.1085/jgp.93.1.1 - DOI - PMC - PubMed
    1. Armstrong C.M., and Hille B.. 1998. Voltage-gated ion channels and electrical excitability. Neuron. 20:371–380. 10.1016/S0896-6273(00)80981-2 - DOI - PubMed
    1. Baylor S.M., and Oetliker H.. 1975. Birefringence experiments on isolated skeletal muscle fibres suggest a possible signal from the sarcoplasmic reticulum. Nature. 253:97–101. 10.1038/253097a0 - DOI - PubMed
    1. Baylor S.M., and Oetliker H.. 1977. Birefringence signals from surface and t-system membranes of frog single muscle fibres. J. Physiol. 264:199–213. 10.1113/jphysiol.1977.sp011663 - DOI - PMC - PubMed
    1. Baylor S.M., Chandler W.K., and Marshall M.W.. 1982. Optical measurements of intracellular pH and magnesium in frog skeletal muscle fibres. J. Physiol. 331:105–137. 10.1113/jphysiol.1982.sp014367 - DOI - PMC - PubMed

Publication types

Substances