. 2018 Jul 27;293(30):11928-11943.
doi: 10.1074/jbc.RA118.002486. Epub 2018 Jun 13.

Probing the correlation between insulin activity and structural stability through introduction of the rigid A6-A11 bond

Affiliations

Probing the correlation between insulin activity and structural stability through introduction of the rigid A6-A11 bond

Shee Chee Ong et al. J Biol Chem. .

Abstract

The development of fast-acting and highly stable insulin analogues is challenging. Insulin undergoes structural transitions essential for binding and activation of the insulin receptor (IR), but these conformational changes can also affect insulin stability. Previously, we substituted the insulin A6-A11 cystine with a rigid, non-reducible C=C linkage ("dicarba" linkage). A cis-alkene permitted the conformational flexibility of the A-chain N-terminal helix necessary for high-affinity IR binding, resulting in surprisingly rapid activity in vivo Here, we show that, unlike the rapidly acting LysB28ProB29 insulin analogue (KP insulin), cis-dicarba insulin is not inherently monomeric. We also show that cis-dicarba KP insulin lowers blood glucose levels even more rapidly than KP insulin, suggesting that an inability to oligomerize is not responsible for the observed rapid activity onset of cis-dicarba analogues. Although rapid-acting, neither dicarba species is stable, as assessed by fibrillation and thermodynamics assays. MALDI analyses and molecular dynamics simulations of cis-dicarba insulin revealed a previously unidentified role of the A6-A11 linkage in insulin conformational dynamics. By controlling the conformational flexibility of the insulin B-chain helix, this linkage affects overall insulin structural stability. This effect is independent of its regulation of the A-chain N-terminal helix flexibility necessary for IR engagement. We conclude that high-affinity IR binding, rapid in vivo activity, and insulin stability can be regulated by the specific conformational arrangement of the A6-A11 linkage. This detailed understanding of insulin's structural dynamics may aid in the future design of rapid-acting insulin analogues with improved stability.

Keywords: biophysical studies; biophysics; conformational change; dicarba peptides; disulfide; disulfide bonds; insulin; molecular dynamics.


Conflict of interest statement

The authors declare that they have no conflicts of interest with the contents of this article.

Figures

Figure 1.
Figure 1.
Insulin, KP insulin, and dicarba insulin analogues. A, primary sequence comparison of human insulin (top) and KP insulin (bottom). Both consist of A (blue) and B (gray) chains stabilized by three disulfide bridges (yellow). Underlined are site 1–binding residues and bold are site 2–binding residues (17). Rapid-acting KP insulin has a reversal of B28 and B29 amino acids (LysB28ProB29) (red) compared with insulin. B, ribbon diagram of human insulin (2-zinc–coordinated T6 conformation (20) PDB entry 1MSO) showing the location of the three α-helices (blue, A chain; gray, B chain) and the three disulfide bonds (yellow). C, schematic diagram of native cystine and isomeric cis- and trans-dicarba bridges. Shown are RP-HPLC chromatograms of native insulin and cis- and trans-dicarba insulins (D) and KP insulin and cis- and trans-dicarba KP insulins (E). mAU, milli-absorbance units.
Figure 2.
Figure 2.
In vitro (A–D) and in vivo (E and F) activity of insulin, KP insulin, and their respective dicarba insulin analogues. A, competition binding of insulin and dicarba insulins with europium-labeled insulin. Results are expressed as a percentage of binding in the absence of competing ligand (% B/B0). B, activation of IR-B by increasing concentration of dicarba insulins (10-min stimulation) is expressed as receptor phosphorylation as a percentage of the maximal phosphorylation induced by insulin. ns (not significant), insulin versus cis-dicarba insulin; ****, p ≤ 0.0001, insulin versus trans-dicarba insulin (two-way ANOVA; Dunnett's multiple comparison). C, DNA synthesis in response to increasing concentrations of dicarba insulins is shown as percentage incorporation of [3H]thymidine (3H-Thy) above basal. All data in A–D are the mean ± S.E. n = at least 3 independent experiments. D, glucose uptake stimulated by increasing concentrations of insulin, cis-dicarba insulin, or cis-dicarba KP insulin is expressed as -fold glucose uptake (pmol/min/mg) above basal. ns (not significant), insulin versus cis-dicarba insulin versus cis-dicarba KP insulin (paired t test). E and F, insulin tolerance test in mice fed on a normal diet (chow) diet (E) or on a high-fat diet (F) were administered through intraperitoneal injection (ip) with 0.75 IU/kg insulin, KP insulin, cis-dicarba insulin, or cis-dicarba KP insulin under non-fasting conditions, and tail vein blood glucose was measured via a glucose meter at the indicated times. n = 5–6/group. Blood glucose levels are expressed as change over basal levels (mmol/liter). Chow diet: **, p ≤ 0.01, insulin versus cis-dicarba insulin; **, p ≤ 0.01, KP insulin versus cis-dicarba KP insulin (paired t test). High fat diet: **, p ≤ 0.01, insulin versus cis-dicarba insulin; **, p ≤ 0.01, KP insulin versus cis-dicarba KP insulin (paired t test). Significance of the change in blood glucose levels at each time point was also determined by two-way ANOVA followed by Holm–Sidak's multiple comparison test. Chow diet: #, p ≤ 0.05, KP insulin versus cis-dicarba KP insulin at t = 60 min. High fat diet: KP insulin versus cis-dicarba KP insulin at t = 30, 45, and 60 min (###, p ≤ 0.001) and t = 90 and 120 min (##, p ≤ 0.01).
Figure 3.
Figure 3.
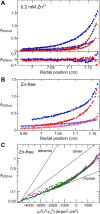
Sedimentation equilibrium data for cis-dicarba insulin in the presence and absence of zinc ion (Zn2+). A and B, radial concentration distributions at sedimentation equilibrium for cis-dicarba insulin in the presence (A) and absence (B) of 0.2 mm Zn2+ at loading concentrations of 100 (open symbols) and 300 μg/ml (closed symbols) at 25,000 (blue) and 40,000 rpm (red). In A, data were globally fitted to a single species of 34,500 ± 400 Da (solid lines). Residuals to the fit (bottom) show some systematic deviation from an ideal fit. C, sedimentation equilibrium data for zinc-free cis-dicarba (green) and native (magenta) insulin at each speed and loading concentration are plotted together as the square of the radial position scaled by rotor speed versus concentration on a logarithmic scale. The slopes expected for monomeric, dimeric, and tetrameric insulin are shown for reference.
Figure 4.
Figure 4.
Time-course of fibril formation detected by AFM. Insulin fibrillation is first evident at t = 6 h. After t = 15 h, insulin has formed aggregates, and fibrils are no longer easily detectable. Fibrillation of cis-dicarba insulin is first evident after t = 2 h and is clearly detectable by t = 6 h. Fibrils formed by the cis-dicarba insulin are of a different structure compared with insulin, particularly evident at t = 15 h. Fibrillation of the monomeric KP insulin is evident at earlier time points across a wider incubation range (t = 2–15 h) compared with insulin. At t = 24 h, KP insulin fibrils are no longer easily detectable. Surprisingly, cis-dicarba KP insulin fibrillation is only evident at t = 6–8 h with a rapid increase in formation of shorter and thicker fibrils at t = 6 h. In summary, the cis-dicarba insulin adopts a different fibrillary pattern compared with insulin with an apparent increased complexity of fibrillary topology. These experiments are representative of n = 4 experiments for insulin, n = 3 for cis-dicarba insulin, n = 5 for KP insulin, and n = 3 for cis-dicarba KP insulin. First detection of fibrils for each analogue is indicated by white arrows. Scale bar (white), 1 μm in all images.
Figure 5.
Figure 5.
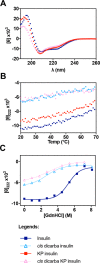
Thermal and chemical stability of cis-dicarba insulin and cis-dicarba KP insulin. A, CD far-UV spectrum of cis-dicarba KP insulin suggests there is a difference in structure of the cis-dicarba KP insulin compared with KP insulin and insulin, where lower helical propensities in the cis-dicarba KP insulin are observed (see Table 1). θ, ellipticity. B, differences in thermal unfolding were monitored by ellipticity at λ = 222 nm and show that both the cis- and trans-dicarba insulins are considerably less stable than insulin. C, unfolding in the presence of guanidine hydrochloride (GdnHCl) demonstrates that both cis-dicarba analogues are considerably destabilized compared with insulin. ΔG values derived from guanidine denaturation studies are listed in Table 1.
Figure 6.
Figure 6.
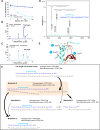
Limited proteolysis of insulin and cis-dicarba insulin using chymotrypsin. A, rate of proteolysis plotted as a percentage of undigested peptide over time. Non-reducing insulin (B) and cis-dicarba insulin (C) digested for t = 60 min were analyzed and fractionated using RP-HPLC. Metabolites A–E were identified via MALDI analyses in combinations of different conditions: whole sample versus RP-HPLC–fractionated samples; non-reducing versus reducing; and positive versus negative detection mode (see Figs. S5 and S6). Indicated in B, C, and F are full-length, undigested peptide; metabolite A, non-reduced metabolite resulting from single cleavage at TyrB26; and metabolites C (C-terminal) and metabolite D (N-terminal), non-reduced metabolites resulting from cleavage at TyrB26 followed by cleavages at TyrA14 and TyrB16. Metabolite E is only present in cis-dicarba insulin cleavage reactions and resulted from single cleavage at TyrB16. D, metabolite E of cis-dicarba insulin was identified in fractioned sample proteolyzed with chymotrypsin for t = 60 min. The sample was treated with DTT (reduction) and IAA (alkylation) before MALDI analysis under negative mode detection. [CME], carboxymethylcystine residues with monoisotopic mass of 58.005 Da. E, cis-dicarba insulin crystal structure (reported in Ref. ; model coordinates not in the PDB database) with circled numbers indicating the order in which cis-dicarba insulin peptide bonds are cleaved by chymotrypsin. F, a simplified chymotryptic digestion kinetics of cis-dicarba insulin showing sequences of peptides arising from chymotrypsin cleavage. Blue solid line, A6–A11 dicarba bond. Insulin is cleaved first to metabolite A and then into metabolites C and D, with no metabolite E being detected. The rate of synthesis of each metabolite is presented in Figs. S3 and S4. Subspecies of each metabolite were also identified via MALDI analyses (see Figs. S5–S7).
Figure 7.
Figure 7.
Bending of the B-chain helix required to enable chymotrypsin proteolysis. A, overlay of the bent structure (red; MD simulation frame for cis-dicarba insulin) with a reference insulin crystal structure (blue; PDB entry 1MSO, chains C and D). Residues A1–A21 and B9–B23 are superimposed. Hydrogen bonds in the B-chain helix connecting residues ValB12 and TyrB16, GluB13 and LeuB17, and TyrB16 and GlyB20 are broken, allowing the Cα–Cα distances between GluB13 and TyrB16 and between TyrB16 and GlyB20 to increase from ∼5.5 to >7 Å. The bending rotates and compresses the A7–B7 disulfide bond and increases the distance between the N-terminal A-chain and B-chain helices (as measured by the Cα–Cα distance between residues A6 and B11). B, superimposition of the B-chain helix of the unbent insulin crystal structure (stick model; PDB entry 1MSO, chains C and D) on the active site of chymotrypsin (dark green; PDB entry 4H4F, chymotrypsin in complex with inhibitor eglin C). For proteolysis to occur, TyrB16 must be recognized by the active site of the enzyme. Superimposition of the backbone atoms of TyrB16 as well as N and CA of LeuB17 on those of the corresponding residues in the inhibitor reveals that the unbent structure cannot engage correctly with the peptidase; residues B12 and B13 and all residues beyond B18 overlap significantly with the chymotrypsin structure, and the side chain of TyrB16 cannot sit properly in the active-site cavity. C, superimposition of the B-chain helix of the bent cis-dicarba insulin simulation frame on the active site of chymotrypsin. Bulging of the B-chain helix allows both the B12–B16 and B16–B20 loops to fit over the surface of the chymotrypsin molecule, with TyrB16 sitting in the middle of the binding pocket. (Note that in both B and C, the side chains of B16, B17, and chymotrypsin residues 143 and 192 have been rotated to give the best possible engagement of the two molecules.) Loops of chymotrypsin that must move out of the way to allow insulin engagement are shown as dark green ribbons.
Figure 8.
Figure 8.
Variations in structural parameters associated with B-chain helix bending from MD simulations for insulin (A) and the cis-dicarba insulin (B). Green, r(Cα–Cα) between GluB13 and TyrB16; this is a direct measure of helix bending. Red, r(Cα–Cα) between residues A6 and B11; a measure of the distance between the N-terminal A-chain and B-chain helices. Purple, r(Cα–Cα) between CysA7 and CysB7; the length of the A7–B7 interchain linker. Blue, the relative torsional energy of the A7–B7 disulfide linkage. Data are presented as 50 period moving averages to highlight trends. Full data are presented in Fig. S8. Overall averages for the purple and blue traces are shown with dashed and dotted lines, respectively. Bond distances are given in Å, and relative torsional energies are shown in kJ mol−1. Bending events in the B-chain helix are outlined in black boxes. Note that each bin on the horizontal axis represents an independent 200-ns simulation; traces are therefore not continuous between bins.

References

    1. Banting F. G., and Best C. H. (2007) The internal secretion of the pancreas. 1922. Indian J. Med. Res. 125, 251–266 - PubMed
    1. Pandyarajan V., and Weiss M. A. (2012) Design of non-standard insulin analogs for the treatment of diabetes mellitus. Curr. Diab. Rep. 12, 697–704 10.1007/s11892-012-0318-z - DOI - PMC - PubMed
    1. Mathieu C., Gillard P., and Benhalima K. (2017) Insulin analogues in type 1 diabetes mellitus: getting better all the time. Nat. Rev. Endocrinol. 13, 385–399 10.1038/nrendo.2017.39 - DOI - PubMed
    1. Adams M. J., Blundell T. L., Dodson E. J., Dodson G. G., Vijayan M., Baker E. N., Harding M. M., Hodgkin D. C., Rimmer B., and Sheat S. (1969) Structure of rhombohedral 2 zinc insulin crystals. Nature 224, 491–495 10.1038/224491a0 - DOI
    1. Weiss M. A. (2009) The structure and function of insulin: decoding the TR transition. Vitam. Horm. 80, 33–49 10.1016/S0083-6729(08)00602-X - DOI - PMC - PubMed

Publication types