. 2018 Jul 9;145(13):dev162396.
doi: 10.1242/dev.162396.

Intracellular biosynthesis of lipids and cholesterol by Scap and Insig in mesenchymal cells regulates long bone growth and chondrocyte homeostasis

Affiliations

Intracellular biosynthesis of lipids and cholesterol by Scap and Insig in mesenchymal cells regulates long bone growth and chondrocyte homeostasis

Hidetoshi Tsushima et al. Development. .

Abstract

During enchondral ossification, mesenchymal cells express genes regulating the intracellular biosynthesis of cholesterol and lipids. Here, we have investigated conditional deletion of Scap or of Insig1 and Insig2 (Scap inhibits intracellular biosynthesis and Insig proteins activate intracellular biosynthesis). Mesenchymal condensation and chondrogenesis was disrupted in mice lacking Scap in mesenchymal progenitors, whereas mice lacking the Insig genes in mesenchymal progenitors had short limbs, but normal chondrogenesis. Mice lacking Scap in chondrocytes showed severe dwarfism, with ectopic hypertrophic cells, whereas deletion of Insig genes in chondrocytes caused a mild dwarfism and shortening of the hypertrophic zone. In vitro studies showed that intracellular cholesterol in chondrocytes can derive from exogenous and endogenous sources, but that exogenous sources cannot completely overcome the phenotypic effect of Scap deficiency. Genes encoding cholesterol biosynthetic proteins are regulated by Hedgehog (Hh) signaling, and Hh signaling is also regulated by intracellular cholesterol in chondrocytes, suggesting a feedback loop in chondrocyte differentiation. Precise regulation of intracellular biosynthesis is required for chondrocyte homeostasis and long bone growth, and these data support pharmacological modulation of cholesterol biosynthesis as a therapy for select cartilage pathologies.

Keywords: Cholesterol; Chondrocyte; Enchodral; Insig; Scap.


Conflict of interest statement

Competing interestsThe authors declare no competing or financial interests.

Figures

Fig. 1.
Fig. 1.
Phenotype of mouse embryos lacking Scap in mesenchymal cells. (A) RT-PCR data for Scap expression in microdissected limb buds from embryos at different stages showing that Scap is expressed during multiple stages of limb development (n=5 for each time point, means and 95% confidence intervals are shown). (B-F) Representative phenotype of embryos and mice in which Scap is inactivated in Prx1-expressing cells. (B) E11.5 embryos. b, d, g and h are embryos lacking Scap in Prx1-expressing cells, whereas the remainder of the images are controls. a, b, e and g are backlit photographs of the embryos in c, d, f and h. e-h are magnified views of the forelimb bud. The limb bud from embryos lacking Scap is rounder and contains a small hematoma compared with controls (n=8 for mutants, 7 for controls). (C) E13.5 embryos, showing a hematoma in the limb bud in embryos lacking Scap in Prx1-expressing cells. Three out of 11 embryos showed a phenotype as in d with a large hematoma encompassing the entire limb bud (n=6 for mutants, 8 for controls). (D) E16.5 embryos. a and b are side views, c and d are front views, and e and f are skeletal preparations. There is a short limb with malformed skeletal elements, which is more severe in the forelimbs (n=7 for mutants, 6 for controls). (E) E18.5 embryos. c, d, g and h show magnified views of the upper (c,g) and lower (g,h) extremities (n=6 for mutants, 7 for controls). (F) Mice at P0. A magnified view of the upper extremity is shown in e and the lower extremity in f (n=4 for mutants, 6 for controls). (G) Hematoxylin and Eosin staining of E11.5 to E16.5 limbs. E11.5 embryos are shown in a-c. Low- (b) and high- (c) magnification views of the forelimb bud from an embryo lacking Scap in Prx1-expressing cells showing disorganized mesodermal differentiation. E12.5 embryos are shown in d and e, showing the formation of a vascular cyst in the limb bud from an embryo lacking Scap in Prx1-expressing cells in e. E13.5 embryos are shown in f-h. A large cyst was found in four out of the six, as shown in g, whereas in two embryos there was an organized hematoma, as shown in h. The humerus at E16.5 (i,j) and the tibia (k,l) showing a substantial lack of cartilage in the limbs from embryos in which Scap is inactivated in Prx1-expressing cells, and a hematoma at the distal aspect of the forearm. Scale bars: 4 mm in Ba-Bd,C-F; 2 mm in Be-Bh; 1 mm in G.
Fig. 2.
Fig. 2.
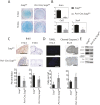
Scap regulates mesenchymal cell proliferation and differentiation. (A) Representative Alcian Blue staining from micromass cultures showing decreased glycosaminoglycan production in limbs from mice with inactivation of Scap in Prx1-expressing cells (n=5 mutant and 5 controls). (B) Relative RNA expression comparing micromass cultures lacking Scap in Prx1-expressing cells with controls, showing decreased expression of markers of chondrogenesis at 10 days (n=6 mutant and 6 controls). Means and 95% confidence intervals are shown. (C) BrdU uptake in limbs. Graphs of means and 95% confidence intervals are underneath, n=6 for each time point and condition. (D) Scap-deficient mice contained TUNEL-stained cells and cleaved caspase 3 in the central regions of the developing bone, whereas TUNEL-stained cells were restricted to the margins of digital rays (n=6 for each genotype). Graphs of means and 95% confidence intervals are underneath, n=6 for each, P<0.05 for each time point and condition. (E) Representative western blot for cyclin D1, caspase 3 and Bax (*P<0.05). Scale bars: 1 mm.
Fig. 3.
Fig. 3.
Scap expression and cholesterol levels are decreased in hypertrophic chondrocytes. (A) Immunofluorescent staining and in situ hybridization of E16.5 embryos showed that Scap protein was expressed in the round cell zone (resting) and proliferation zone, but was decreased in the hypertrophic zone. Left panel is immunofluorescent staining, middle panels are magnified views of the three zones and the right panels show in situ hybridization. Scale bars: 100 μm. (B) RT-PCR data from microdissected regions of the proliferating zone (PZ) and hypetrophic zone (HZ) of the growth plate showing differential regulation of Scap and other genes involved in intracellular biosynthesis of cholesterol and lipids (from E16.5 limbs, n=8 in each group). Black represents controls; gray represents cells from limbs lacking Scap. (C) Cholesterol levels in the proliferating zone (PZ) and hypetrophic zone (HZ) of the growth plate (n=4). (D,E) Scap expression micromass cultures also showed that Scap expression was gradually decreased over time as cells progressed through chondrocytic differentiation. D shows RNA data (n=8) and E a representative western blot. Means and 95% confidence intervals are shown (*P<0.05).
Fig. 4.
Fig. 4.
Loss of Scap in chondrocytes results in a disordered growth plate and severe dwarfism. (A) Immunohistochemistry for SCAP (left) and filipin fluorescent staining (right) for control limbs (top) and for limbs from mice lacking Scap in Col2a1-expressing cells (bottom), confirming lack of SCAP expression and decreased intracellular cholesterol and lipids in mutant mice. (B,C) Whole-mount and skeletal preparations of representative E12.5 to P0 mice. Top rows show mice expressing Scap in Col2a1-expressing cells; the bottom rows show mice lacking Scap in these cells (n>5 for each genotype at each age). P0 images of the spine and limb show a lack of spinal cartilage development and severely shortened long bones. (D) Hematoxylin and Eosin staining of fetal limbs of E16.5 humerus sections with control limbs on the right, limbs from a mouse lacking Scap in one allele in the middle and limbs from a mouse lacking Scap in both alleles in Col2a1-expressing cells on the left. (E) Magnified views of 16.5 humeri showing views of the resting, proliferating and hypertrophic zones. The mutant limb demonstrates ectopic hypertrophic cells. (F) Alcian Blue staining of the upper limb. (G) Type X collagen staining of the upper limb. (H) BrdU incorporation, with the limbs from mice lacking Scap. (I) Expression of various genes in the mutant and control limbs. Means and 95% confidence intervals are shown (*P<0.05). Scale bars: 250 μm in A; 4 mm in B,C; 500 μm in D-H.
Fig. 5.
Fig. 5.
Exogenous cholesterol does not change the phenotype of chondrocytes lacking Scap in Col2-expressing cells. (A) Serum cholesterol levels in mice lacking Scap in chondrocytes at P0, showing no difference between serum cholesterol levels between Scap-deficient and control mice (n=5 in each group). (B) Intracellular cholesterol levels measured using mass spectroscopy in chondrocyte cultures from Scap-deficient and control mice (n=8 at each time point for each genotype). Cholesterol levels increase with cholesterol supplementation, but in Scap-deficient cells this did not reach the same level as observed in control cells. (C) Filipin staining showing that treatment with cholesterol increases staining in cultures, but cholesterol supplementation cannot increase the levels in Scap-deficient cells to levels observed in controls. High-power magnification shows intracellular localization. Cholesterol is primarily located in the cytoplasm in these cells, regardless of the genotype. Scale bars: 20 μm. (D) Overexpression of Ldlr in Scap-deficient chondrocytes increases intracellular cholesterol. (E) Cholesterol levels increase with overexpression of Ldlr. (F) RT-PCR for expression of Acan, Col2a1 and Sox9 in cultures from Scap-deficient and control mice, with or without cholesterol supplementation or overexpression, or overexpression of Ldlr (n=5 in each group). Data are mean with 95% confidence levels (*P<0.05 compared with control, i.e. each genotype without cholesterol supplementation or Ldlr overexpression).
Fig. 6.
Fig. 6.
Deletion of Insig genes within mesenchymal cells or chondrocytes causes dwarfism. (A) Representative whole-mount, skeleton and long bone histology of E18.5 embryos and mice, showing dwarfism but intact overall bone structure when comparing mice lacking both Insig genes in Prx1-expressing cells with controls. (B) Femur length of E18.5 Prx1-cre; Insig1flox/flox; Insig2−/− and Insig1flox/flox; Insig2−/− embryos. The length of Insig1flox/flox; Insig2−/− is normalized to 1 (n=8 for Prx1-cre; Insig1flox/flox; Insig2−/− and 9 for Insig1flox/flox; Insig2−/−). Data are means with 95% confidence intervals. *P<0.05 compared with data from Insig1flox/flox; Insig2−/−. (C) The histology of the humeral growth plate at P0. R, resting zone; P, proliferative zone; H, hypertrophic zone. Bottom panels show type X collagen staining labeling the hypertrophic zone. (D) Relative length of type X collagen-expressing cells with the length of the growth plates in C. Insig1flox/flox; Insig2−/− is normalized to 1 (n=6 for Prx1-cre; Insig1flox/flox; Insig2−/− and 5 for Insig1flox/flox; Insig2−/−). Data are mean with 95% confidence intervals (*P<0.05 compared with data from Insig1flox/flox; Insig2−/−). (E) Representative skeletons of embryos and mice showing dwarfism in mice lacking both Insig genes in Col2a1-expressing cells, showing intact overall bone structure compared with controls. (F) Femur length of P0 Col2-cre; Insig1flox/flox; Insig2−/− and Insig1flox/flox; Insig2−/− embryos. The length of Insig1flox/flox; Insig2−/− is normalized to 1 (n=7 for Col2-cre; Insig1flox/flox; Insig2−/− and 7 for Insig1flox/flox; Insig2−/−). Data are mean with 95% confidence intervals (*P<0.05 compared with data from Insig1flox/flox; Insig2−/−. (G) Representative histology of an E16.5 humerus. Alcian Blue and type X collagen staining of the same limbs are shown. R, resting zone; P, proliferative zone; H, hypertrophic zone. (H) Representative images of mice at P0. (I) Relative length of type X collagen-expressing cells with the length of the growth plates in P0 limbs. Insig1flox/flox; Insig2−/− is normalized to 1 (n=5 for Col2-cre; Insig1flox/flox; Insig2−/− and 6 for Insig1flox/flox; Insig2−/−). Data are means with 95% confidence intervals (*P<0.05 compared with data from Insig1flox/flox; Insig2−/−). Scale bars: 4 mm in A,E; 1 mm in C,G,H.
Fig. 7.
Fig. 7.
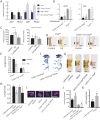
Hedgehog and cholesterol regulating each other in the growth plate. (A) Expression of Ihh and Hedgehog target genes in cells from mice lacking Scap or the Insig genes in Col2-expressing cells and controls (n=6 for each genotype). Expression in littermate controls was arbitrarily normalized to 1. (B) Effect of treatment with 3 μg/ml exogenous cholesterol on Hh target gene expression on chondrocyte cultures from mice lacking Scap in chondrocytes or littermate controls. Data are mean with 95% confidence intervals (*P<0.05). Data are normalized so that expression in littermate controls averages 1 (n=5 in each group). (C) Cholesterol levels in metatarsal explants treated with Ihh or control. (D) Treatment with the Ihh-N ligand in mice lacking Scap in Col2-expressing cells resulted in a level of type X collagen expression similar to that seen in control explants. Vertical line shows the length of type X collagen-expressing cells. (E) Graph shows the length of collagen type X collagen-expressing cells in the explants (n=5 in each group). (F) Crossing mice lacking Scap in Col2a1-expressing cells with mice overexpressing Gil2 in in Col2a1-expressing cells, results in a partial rescue of the phenotype shown in E16.5 mice. (G) Metatarsals from E16.5 mice showing rescue of type X collagen-expressing cells in mice overexpressing Gli2 by depleting Scap. Vertical line shows the length of type X collagen-expressing cells. (H) Length of type X collagen-expressing cells. Data are means with 95% confidence intervals from samples in G (*P<0.05). n>8 for each genotype at each time point. (I) Filipin staining of representative chondrocytes from mice in G. (J) Cholesterol level in cells. Data are means with 95% confidence intervals (*P<0.05). n=4 in each group. (K) Ldlr expression, with level in littermate controls normalized to 1. Data are mean with 95% confidence intervals (*P<0.05). n=6 in each group. Scale bars (horizontal lines): 1 mm in D,G; 4 mm in F; 20 μm in I.

Similar articles

Cited by

References

    1. Ali S. A., Al-Jazrawe M., Ma H., Whetstone H., Poon R., Farr S., Naples M., Adeli K. and Alman B. A. (2016). Regulation of cholesterol homeostasis by hedgehog signaling in osteoarthritic cartilage. Arthritis Rheumatol. 68, 127-137. 10.1002/art.39337 - DOI - PMC - PubMed
    1. August E., Parker K. H. and Barahona M. (2007). A dynamical model of lipoprotein metabolism. Bull. Math. Biol. 69, 1233-1254. 10.1007/s11538-006-9132-6 - DOI - PubMed
    1. Ayciriex S., Regazzetti A., Gaudin M., Prost E., Dargère D., Massicot F., Auzeil N. and Laprévote O. (2012). Development of a novel method for quantification of sterols and oxysterols by UPLC-ESI-HRMS: application to a neuroinflammation rat model. Anal. Bioanal. Chem. 404, 3049-3059. 10.1007/s00216-012-6396-6 - DOI - PubMed
    1. Bornig H. and Geyer G. (1974). Staining of cholesterol with the fluorescent antibiotic “filipin”. Acta Histochem. 50, 110-115. - PubMed
    1. Brown M. S. and Goldstein J. L. (1999). A proteolytic pathway that controls the cholesterol content of membranes, cells, and blood. Proc. Natl. Acad. Sci. USA 96, 11041-11048. 10.1073/pnas.96.20.11041 - DOI - PMC - PubMed

Publication types

MeSH terms