. 2018 Jun;15(143):20180060.
doi: 10.1098/rsif.2018.0060.

A unified stochastic modelling framework for the spread of nosocomial infections

Affiliations

A unified stochastic modelling framework for the spread of nosocomial infections

Martín López-García et al. J R Soc Interface. 2018 Jun.

Abstract

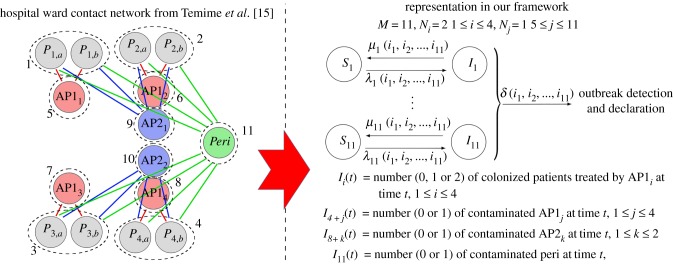
Over the last years, a number of stochastic models have been proposed for analysing the spread of nosocomial infections in hospital settings. These models often account for a number of factors governing the spread dynamics: spontaneous patient colonization, patient-staff contamination/colonization, environmental contamination, patient cohorting or healthcare workers (HCWs) hand-washing compliance levels. For each model, tailor-designed methods are implemented in order to analyse the dynamics of the nosocomial outbreak, usually by means of studying quantities of interest such as the reproduction number of each agent in the hospital ward, which is usually computed by means of stochastic simulations or deterministic approximations. In this work, we propose a highly versatile stochastic modelling framework that can account for all these factors simultaneously, and which allows one to exactly analyse the reproduction number of each agent at the hospital ward during a nosocomial outbreak. By means of five representative case studies, we show how this unified modelling framework comprehends, as particular cases, many of the existing models in the literature. We implement various numerical studies via which we (i) highlight the importance of maintaining high hand-hygiene compliance levels by HCWs, (ii) support infection control strategies including to improve environmental cleaning during an outbreak and (iii) show the potential of some HCWs to act as super-spreaders during nosocomial outbreaks.

Keywords: Markov chain; antibiotic-resistant bacteria; hospital-acquired or nosocomial infections; infection control; reproduction number; stochastic model.


Conflict of interest statement

We declare we have no competing interests.

Figures

Figure 1.
Figure 1.
Diagram representing the epidemic dynamics among M different compartmental levels.
Figure 2.
Figure 2.
Model by Artalejo [21] and its corresponding representation in our framework. Our representation leads to the same stochastic process to that in [21]. Case study 1. (Online version in colour.)
Figure 3.
Figure 3.
Probability mass functions of the reproduction number of a colonized patient (R(1)(1,0), a) and of a contaminated HCW (R(2)(0,1), b) starting the outbreak. Average detection time of each patient γ−1 ∈ {1, 2, 3, 4} days. Case study 1.
Figure 4.
Figure 4.
Model by Wang et al. [22] and its corresponding representation in our framework. Our representation leads to the same stochastic process to that in [22], when formula image. Case study 2. (Online version in colour.)
Figure 5.
Figure 5.
Mean reproduction number of a colonized patient starting the outbreak, among HCWs (E[R(1)(1,0,0)(2)], a) and volunteers (E[R(1)(1,0,0)(3)], b), versus δ−1C, η and ξ. Blue dot corresponds to parameter values (η, ξ, δ−1C) = (0.46, 0.23, 13.0) in electronic supplementary material, Table S2, leading to values E[R(1)(1,0,0)(2)] = 10.05 and E[R(1)(1,0,0)(3)] = 0.65. Case study 2.
Figure 6.
Figure 6.
Mean reproduction number of a HCW (E[R(2)(0,1,0)], a) and a volunteer (E[R(3)(0,0,1)], b), versus γH, η, γV and ξ. Blue dot corresponds to parameter values (γH, η, γV, ξ) = (24.0, 0.46, 12.0, 0.23) in electronic supplementary material, Table S2, leading to values E[R(2)(0,1,0)] = 0.02 and E[R(3)(0,0,1)] = 0.01. Case study 2.
Figure 7.
Figure 7.
Model by Wolkewitz et al. [23] and its corresponding representation in our framework. Our representation leads to the same stochastic process to that in [23]. Case study 3. (Online version in colour.)
Figure 8.
Figure 8.
Mean reproduction number of a colonized patient among HCWs (E[R(1)(1,0,0)(2)], a) and among surfaces (E[R(1)(1,0,0)(3)], b), versus γ−1, βps and βpe. Blue dot corresponds to parameter values (βps, βpe, γ−1) = (2.0, 2.0, 20.0) in electronic supplementary material, Table S3, leading to values E[R(1)(1,0,0)(2)] = 9.09 and E[R(1)(1,0,0)(3)] = 96.83. Case study 3.
Figure 9.
Figure 9.
Mean reproduction number of a HCW among patients (E[R(2)(0,1,0)(1)], a) and among surfaces (E[R(2)(0,1,0)(3)], b), versus μ, βse and βsp. Blue dot corresponds to parameter values (βsp, βse, μ) = (0.3, 2.0, 24.0) in electronic supplementary material, Table S3, leading to values E[R(2)(0,1,0)(1)] = 0.05 and E[R(2)(0,1,0)(3)] = 1.64. Case study 3.
Figure 10.
Figure 10.
Mean reproduction number of a surface among patients (E[R(3)(0,0,1)(1)], a) and among HCWs (E[R(3)(0,0,1)(2)], b), versus κ, βes and βep. Blue dot corresponds to parameter values (βes, βep, κ) = (2.0, 0.3, 1.0) in electronic supplementary material, Table S3, leading to values E[R(3)(0,0,1)(1)] = 0.06 and E[R(3)(0,0,1)(2)] = 0.10. Case study 3.
Figure 11.
Figure 11.
Hospital ward room configuration from López-García [19] and its representation in our framework. Our representation leads to an arguably more realistic stochastic process to that in [19], where patients arrival and discharge are incorporated. Case study 4. (Online version in colour.)
Figure 12.
Figure 12.
Mean reproduction number of a colonized patient at Room 1 (E[R(1)(1,0,0,0)], a) and at Room 2 (E[R(2)(0,1,0,0)], b) starting the outbreak, versus (βSR, βDR). Blue dot corresponds to parameter values (βSR, βDR) = (0.0366, 0.0238) in electronic supplementary material, Table S4, leading to values E[R(1)(1,0,0,0)] = 1.62 and E[R(2)(0,1,0,0)] = 1.54. Case study 4.
Figure 13.
Figure 13.
Staff–patient contact network from Temime et al. [15] and representation in our framework. Our representation leads to a simplified version of the stochastic process in [15], for a reduced version of the hospital ward represented in [, fig. 1]. Case study 5. (Online version in colour.)
Figure 14.
Figure 14.
Mean reproduction number of patient P1a among all HCWs treating him/her (formula image
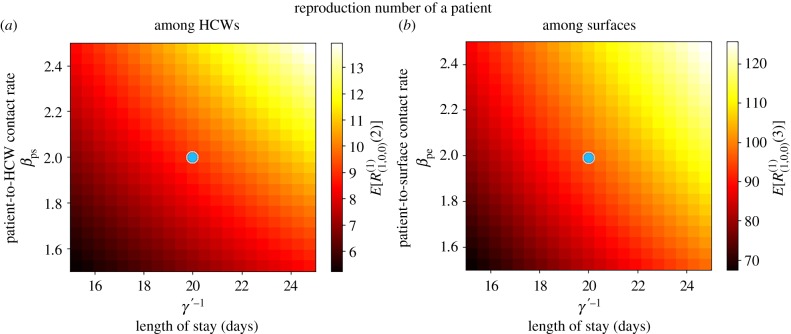
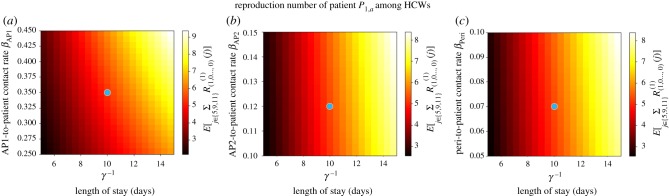
), versus γ−1, βAP1, βAP2 and βPeri, for μ = 24 times d−1. Blue dot corresponds to parameter values (βAP1, βAP2, βPeri) = (0.35, 0.12, 0.07) in electronic supplementary material, Table S5, leading to value formula image. Case study 5.
Figure 15.
Figure 15.
Mean reproduction number of an AP1 (E[R(5)(0,0,0,0,1,0, … ,0)(1)], a), an AP2 (E[R(9)(0, … ,0,1,0,0)(1) + R(9)(0, … ,0,1,0,0)(2)], b) and the peripatetic (formula image
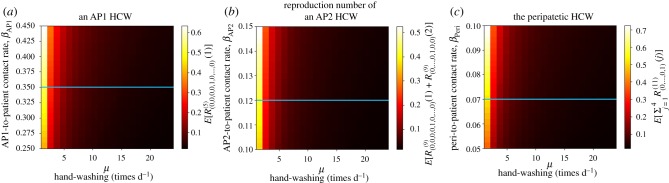
, c) HCW starting the outbreak, among the patients that they treat, versus μ, βAP1, βAP2 and βPeri. Blue line corresponds to parameter values explored in electronic supplementary material, Table S5. Case study 5.

References

    1. Harbarth S, Sax H, Gastmeier P. 2013. The preventable proportion of nosocomial infections: an overview of published reports. J. Hosp. Infect. 54, 258–266. (10.1016/S0195-6701(03)00150-6) - DOI - PubMed
    1. van Kleef E, Robotham JV, Jit M, Deeny SR, Edmunds WJ. 2013. Modelling the transmission of health-care associated infections: a systematic review. BMC Infect. Dis. 13, 294 (10.1186/1471-2334-13-294) - DOI - PMC - PubMed
    1. Pelupessy I, Bonten MJ, Diekmann O. 2002. How to assess the relative importance of different colonization routes of pathogens within hospital settings. Proc. Natl Acad. Sci. USA 99, 5601–5605. (10.1073/pnas.082412899) - DOI - PMC - PubMed
    1. Taubes G. 2008. The bacteria fight back. Science 321, 356–361. (10.1126/science.321.5887.356) - DOI - PubMed
    1. Chamchod F, Ruan S. 2012. Modeling the spread of methicillin-resistant Staphylococcus aureus in nursing homes for eldery. PLoS ONE 7, e29757 (10.1371/journal.pone.0029757) - DOI - PMC - PubMed

Publication types