. 2018 Jun 13;9(6):297.
doi: 10.3390/genes9060297.

Deciphering the Adaptation of Corynebacterium glutamicum in Transition from Aerobiosis via Microaerobiosis to Anaerobiosis

Affiliations

Deciphering the Adaptation of Corynebacterium glutamicum in Transition from Aerobiosis via Microaerobiosis to Anaerobiosis

Julian Lange et al. Genes (Basel). .

Abstract

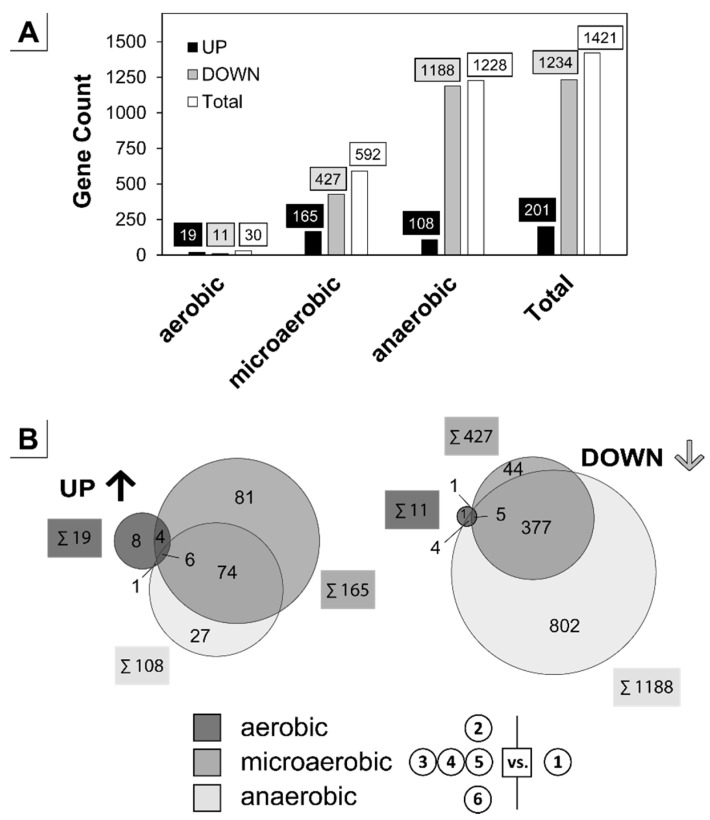
Zero-growth processes are a promising strategy for the production of reduced molecules and depict a steady transition from aerobic to anaerobic conditions. To investigate the adaptation of Corynebacterium glutamicum to altering oxygen availabilities, we conceived a triple-phase fermentation process that describes a gradual reduction of dissolved oxygen with a shift from aerobiosis via microaerobiosis to anaerobiosis. The distinct process phases were clearly bordered by the bacteria’s physiologic response such as reduced growth rate, biomass substrate yield and altered yield of fermentation products. During the process, sequential samples were drawn at six points and analyzed via RNA-sequencing, for metabolite concentrations and for enzyme activities. We found transcriptional alterations of almost 50% (1421 genes) of the entire protein coding genes and observed an upregulation of fermentative pathways, a rearrangement of respiration, and mitigation of the basic cellular mechanisms such as transcription, translation and replication as a transient response related to the installed oxygen dependent process phases. To investigate the regulatory regime, 18 transcriptionally altered (putative) transcriptional regulators were deleted, but none of the deletion strains showed noticeable growth kinetics under an oxygen restricted environment. However, the described transcriptional adaptation of C. glutamicum resolved to varying oxygen availabilities provides a useful basis for future process and strain engineering.

Keywords: Corynebacterium glutamicum; aerobiosis; anaerobiosis; microaerobiosis; transcriptional response; triple-phase process.


Conflict of interest statement

The authors declare no conflict of interest.

Figures

Figure A1
Figure A1
Shaking flask cultivation of C. glutamicum WT in CGXII + 60 g glucose L−1. Error bars represent the SD of five independent experiments.
Figure A2
Figure A2
Carbon balance of the triple-phase process. Analyzed products (biomass, lactate, succinate, acetate and CO2) were balanced with respect to glucose as sole carbon source over the entire cultivation period of 0–16 h (Figure 1A). Error bars represent the SD of four independent experiments.
Figure A3
Figure A3
Pearson correlation of RNA-sequencing data. The log2TPM values within the entire raw RNA-sequencing data were correlated (no significance constraints applied). Sample IDs of the triple-phase process from left to right aerobiosis (①, ②), microaerobiosis (③, ④, ⑤) and anaerobiosis (⑥).
Figure A4
Figure A4
Cultivation of C. glutamicum WT and ΔoxyR under progressing oxygen limitation in shaking flasks with baffles or without baffles in CGXII + 40 g glucose L−1 as sole carbon source. (A) WT cultivation in baffled (filled symbols) and unbaffled (open symbols) shaking flasks. (B,C) Cultivation of C. glutamicum ΔoxyR in shaking flasks with baffles (B) and without baffles (C). In both graphs the WT cultivation is shown in grey (circles). Error bars show SD of four independent cultivations of the C. glutamicum WT strain. For C. glutamicum ΔoxyR (black, diamonds) the average of two comparable independent cultivations is depicted.
Figure 1
Figure 1
The triple-phase process with Corynebacterium glutamicum cultivated in CGXII + 60 g glucose L−1. (A) The 30 L bioreactor cultivation in 10 L minimal medium was realized with constant agitation (445 rpm) throughout the entire process and a gassing of 0.1 vvm within the aerobic (dark grey) and microaerobic (grey) phase. The anaerobic (light grey) phase was initiated by a stop of aeration and temporary flushing of the headspace with N2. Sampling for e.g., RNA-sequencing analysis is indicated with circled numbers (①, ②, ③, ④, ⑤, ⑥); (B) Biomass/substrate yield (YX/S); (C) Product/substrate yields (YP/S). Error bars and shaded area of the dissolved oxygen (DO) represent the standard deviation (SD) of four independent experiments.
Figure 2
Figure 2
Overall transcriptional changes during the triple-phase process. RNA-sequencing analysis was conducted with a log-fold change (m-value, >1.50, <–1.50) and an average differential expression value (a-value, >1.00) cutoff with the aerobic state ① serving as reference. (A) Differentially expressed genes were counted within the aerobic (②), microaerobic (③, ④, ⑤) and anaerobic (⑥) phase and summed over the total process timeframe (Figure 1A). For the microaerobic phase (samples ③, ④, ⑤) an average value was calculated and allocated to up- or downregulation. (B) Venn diagram separated into up- and downregulated genes within the three major process phases. The sum of totally altered genes is given in boxes beside the circle of the respective phase.
Figure 3
Figure 3
Transcriptional response to a shift from aerobiosis via microaerobiosis to anaerobiosis including genes of glycolysis, tricarboxylic acid cycle (TCA), glyoxylate shunt, oxidative pentose phosphate pathway and selected amino acid biosynthesis pathways. Column graphs represent log2-fold changes of enhanced (black) and reduced (grey) expression. Values outside the significance constraints (m-value > 1.50, < −1.50 and a-value > 1.00) are also shown (white). From left to right aerobiosis (②), microaerobiosis (③, ④, ⑤) and anaerobiosis (⑥) versus the aerobic reference (①; Figure 1A). Abbreviations of the given genes: aceA (isocitrate lyase), aceB (malate synthase), adhA (alcohol dehydrogenase), aspT (aspartate aminotransferase), alaT (alanine aminotransferase), ald (acetaldehyde dehydrogenase), fbp (fructose-1,6-bisphosphatase), fda (fructose-bisphosphate aldolase), fum (fumarate hydratase), gapA (glyceraldehyde-3-phosphate dehydrogenase), gdh (glutamate dehydrogenase), gltA (citrate synthase), glyA (serine hydroxymethyltransferase), ilvBN (acetohydroxyacid synthase), ilvC (acetohydroxyacid isomeroreductase), ldhA (l-lactate dehydrogenase), leuA (2-isopropylmalate synthase), leuB (3-isopropylmalate dehydrogenase), leuCD (3-isopropylmalate dehydratase), malE (malic enzyme), mdh (malate dehydrogenase), pck (phosphoenolpyruvate carboxykinase), pfk (6-phosphofructokinase), pgk (3-phosphoglycerate kinase), ppc (phosphoenolpyruvate carboxylase), pyc (pyruvate carboxylase), sdhABCD (succinate dehydrogenase), serA (phosphoglycerate dehydrogenase), serB (phosphoserine phosphatase), sucCD (succinyl-CoA synthetase), tpi (triosephosphate isomerase), zwf (subunit of the glucose-6P dehydrogenase). Graphic represents extended version to literature [81].
Figure 4
Figure 4
(A) Specific activities of the glucose-6P dehydrogenase (G6P-DH) and 6P-gluconate dehydrogenase (6PG-DH) in U per mg total protein. (B) Intracellular l-glutamate analysis in samples taken during the triple-phase process [aerobic (①, ②), microaerobic (③, ④, ⑤), anaerobic conditions (⑥); Figure 1A]. Error bars represent SD of three (A) or four (B) independent experiments.
Figure 5
Figure 5
Transcriptional response of the cytochrome bc1-aa3 and cytochrome bd oxidase to altering oxygen availabilities. (A) Genetic organization and operon structures. Binding of the transcriptional regulators GlxR, RamB, HcrA and OxyR is indicated. (B) Schematic organization of the cytochrome oxidases in the cytoplasmic membrane. Column graphs represent log2-fold changes of enhanced (black) and reduced (grey) expression. Open columns are values outside the significance constraints (m-value > 1.50, < −1.50 and a-value > 1.00). From left to right aerobiosis (②), microaerobiosis (③, ④, ⑤), and anaerobiosis (⑥) versus the aerobic reference (①; Figure 1A). Scaling of the graphs is variable. Shading links genes to proteins. Graphic A and B based on the online tool CoryneRegNet and Bott and Niebisch, respectively [86,87].
Figure 6
Figure 6
Correlation of total RNA content and growth rate within the triple-phase process. (A) The growth rate (µ, 1) and the total RNA per cell (2) is depicted from left to right for the process phases: aerobiosis (①, ②), microaerobiosis (③, ④, ⑤), and anaerobiosis (⑥; Figure 1A). (B) Direct correlation of the total RNA content and the growth rate. Linear regression was calculated neglecting the first sampling point (①, open circle). Error bars represent SD of a triplicate experiment.
Figure 7
Figure 7
Hypothetical model of C. glutamicum’s response to micro- and anaerobiosis including unknown regulatory mechanisms, metabolites, or cellular signals (?). Reinforcement and mitigation is visualized by arrowheads and squares, respectively. Column graphs (with exception of intracellular l-glutamate titers) represent log2-fold changes of enhanced (black) and reduced (grey) expression. Open columns are values outside the significance constraints (m-value > 1.50, <−1.50 and a-value > 1.00). From left to right aerobiosis (②), microaerobiosis (③, ④, ⑤) and anaerobiosis (⑥) versus the aerobic reference (①; Figure 1A). Scaling of these graphs is variable. Intracellular l-glutamate pools are depicted relatively to aerobic intracellular titers analogously to differential expression column graphs. Error bars represent SD. Abbreviations: RNAP, RNA polymerase; DNAP, DNA polymerase.

Similar articles

Cited by

References

    1. Ajinomoto Co., Inc. FY2015 Market and Other Information. [(accessed on 7 September 2017)]; Available online: https://www.ajinomoto.com/en/ir/event/presentation/main/09/teaserItems1/....
    1. Becker J., Wittmann C. Advanced biotechnology: Metabolically engineered cells for the bio-based production of chemicals and fuels, materials, and health-care products. Angew. Chem. Int. Ed. 2015;54:3328–3350. doi: 10.1002/anie.201409033. - DOI - PubMed
    1. Liebl W. Corynebacterium taxonomy. In: Eggeling L., Bott M., editors. Handbook of Corynebacterium Glutamicum. CRC Press; Boca Raton, FL, USA: 2005. pp. 9–34.
    1. Nishimura T., Vertès A.A., Shinoda Y., Inui M., Yukawa H. Anaerobic growth of Corynebacterium glutamicum using nitrate as a terminal electron acceptor. Appl. Microbiol. Biotechnol. 2007;75:889–897. doi: 10.1007/s00253-007-0879-y. - DOI - PubMed
    1. Wieschalka S., Blombach B., Eikmanns B.J. Engineering Corynebacterium glutamicum for the production of pyruvate. Appl. Microbiol. Biotechnol. 2012;94:449–459. doi: 10.1007/s00253-011-3843-9. - DOI - PubMed

LinkOut - more resources