

Using the Baidu Search Index to Predict the Incidence of HIV/AIDS in China
- PMID: 29899360
- PMCID: PMC5998029
- DOI: 10.1038/s41598-018-27413-1
Using the Baidu Search Index to Predict the Incidence of HIV/AIDS in China
Abstract
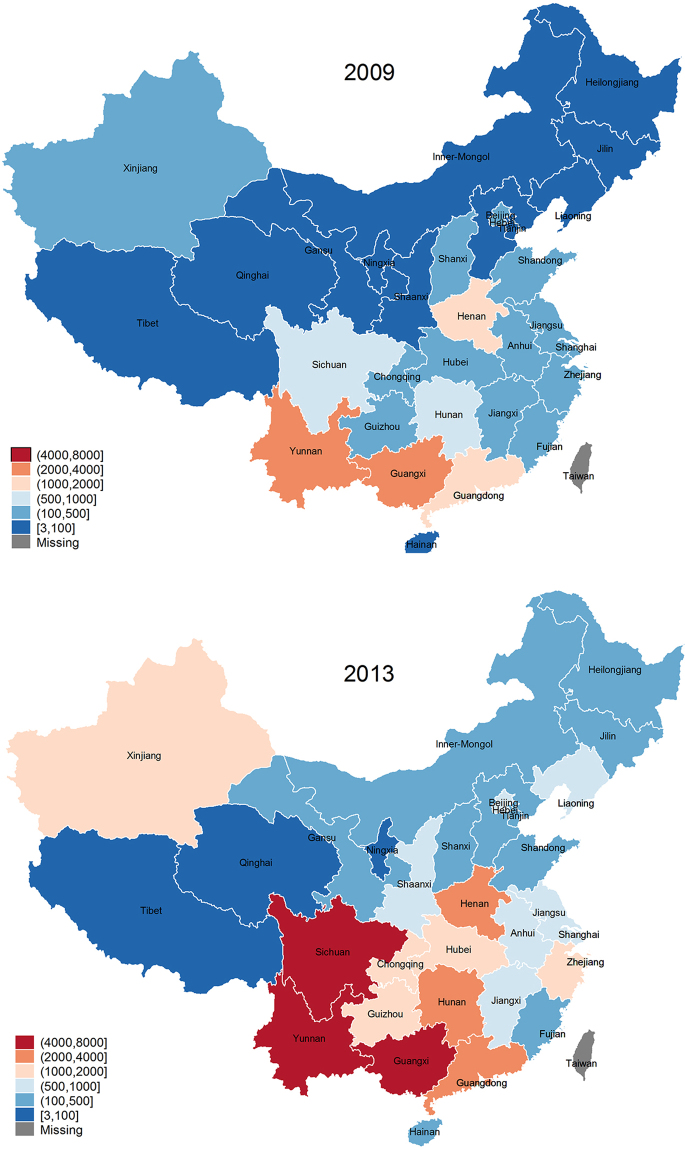
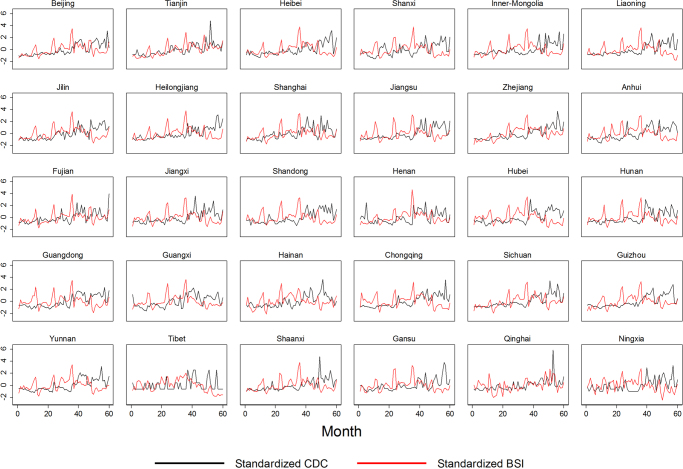
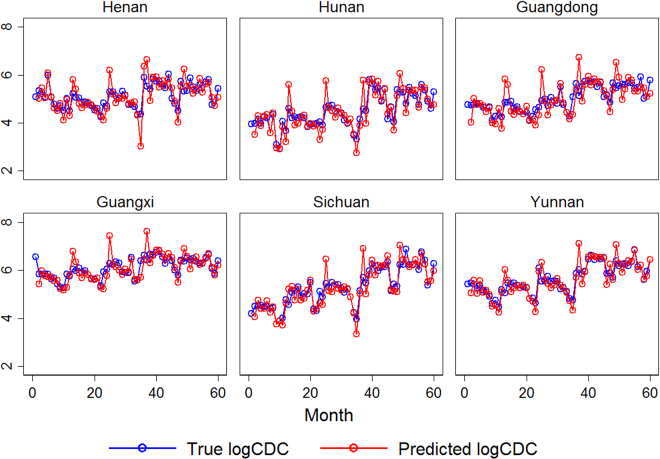
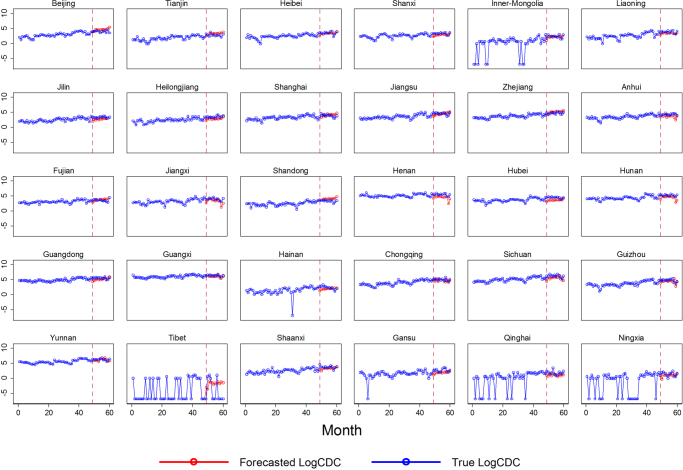
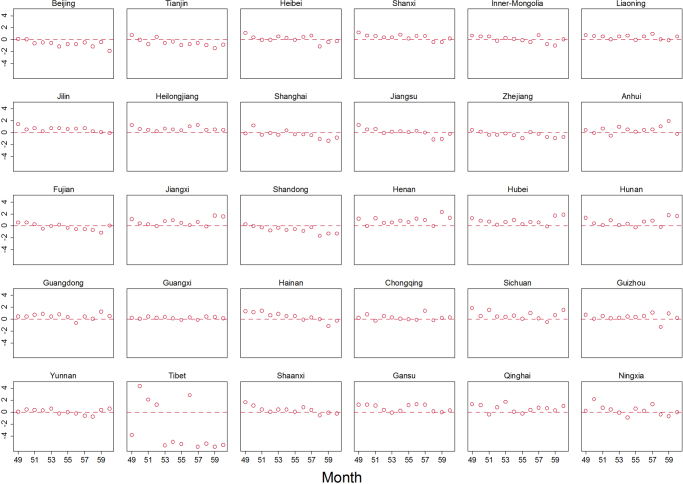
Based on a panel of 30 provinces and a timeframe from January 2009 to December 2013, we estimate the association between monthly human immunodeficiency virus/acquired immune deficiency syndrome (HIV/AIDS) incidence and the relevant Internet search query volumes in Baidu, the most widely used search engine among the Chinese. The pooled mean group (PMG) model show that the Baidu search index (BSI) positively predicts the increase in HIV/AIDS incidence, with a 1% increase in BSI associated with a 2.1% increase in HIV/AIDS incidence on average. This study proposes a promising method to estimate and forecast the incidence of HIV/AIDS, a type of infectious disease that is culturally sensitive and highly unevenly distributed in China; the method can be taken as a complement to a traditional HIV/AIDS surveillance system.
Conflict of interest statement
The authors declare no competing interests.
Figures
References
-
- Zheng X. A Preliminary Study on the Behavior of 225 Drug Abusers and the Risk Factors of HIV Infection in Ruili County, Yunnan Province. Chin Med J. 1991;12(1):12–14. - PubMed
-
- Cheng, H. et al. Yunnan sheng HIV ganran quyu xiang quansheng bosan [The Trend toward HIV Infection and Transmission throughout Yunnan Province]. Zhongguo xingbing aizibing fangzhi [Chinese Journal of Prevention and Control of STIs and HIV/AIDS] 2(2): 54–57 (1996).
-
- China Health and Family Planning Commission. China AIDS Response Progress Report (2015).
-
- National Health and Family Planning Commission of the People’s Republic of China. China AIDS Response Progress Report. Beijing: Chinese Ministry of Health http://www.unaids.org/sites/default/files/country/documents/CHN_narrativ... (2015).
MeSH terms
LinkOut - more resources
Full Text Sources
Other Literature Sources
Medical
