. 2018 Jun 13;9(1):2312.
doi: 10.1038/s41467-018-04632-8.

Network biology discovers pathogen contact points in host protein-protein interactomes

Affiliations

Network biology discovers pathogen contact points in host protein-protein interactomes

Hadia Ahmed et al. Nat Commun. .

Abstract

In all organisms, major biological processes are controlled by complex protein-protein interactions networks (interactomes), yet their structural complexity presents major analytical challenges. Here, we integrate a compendium of over 4300 phenotypes with Arabidopsis interactome (AI-1MAIN). We show that nodes with high connectivity and betweenness are enriched and depleted in conditional and essential phenotypes, respectively. Such nodes are located in the innermost layers of AI-1MAIN and are preferential targets of pathogen effectors. We extend these network-centric analyses to Cell Surface Interactome (CSILRR) and predict its 35 most influential nodes. To determine their biological relevance, we show that these proteins physically interact with pathogen effectors and modulate plant immunity. Overall, our findings contrast with centrality-lethality rule, discover fast information spreading nodes, and highlight the structural properties of pathogen targets in two different interactomes. Finally, this theoretical framework could possibly be applicable to other inter-species interactomes to reveal pathogen contact points.


Conflict of interest statement

The authors declare no competing interests.

Figures

Fig. 1
Fig. 1
Hubs and bottlenecks are enriched in conditional phenotypes. a Schematic representation of high degree (hub; red), high betweenness (bottleneck; blue), and high eigenvector (green) nodes in a hypothetical network. b Cataloging loss-of-function mutant phenotypes in Arabidopsis based on five phenotypic groups: essential (ESN), morphological (MRP), cellular-biochemical (CLB), conditional (CND), and no phenotypes (NPH). c, d Node distribution corresponding to degree (c) and betweenness (d) for five phenotypic groups. CND phenotype enrichment for hub and betweenness are shown. e Relationship between node betweenness and degree distribution to identify high degree/high betweenness (HDHB), high degree/low betweenness (HDLB), low degree/high betweenness (LDHB) as well as low degree/low betweenness (LDLB) nodes (correlation coefficient of r2 = 0.87). f Hypergeometric test to determine the overrepresentation of a particular phenotypic group in nodes belonging to HDHB (P = 0.03), HDLB (P > 0.05), LDHB (P > 0.05), and LDLB (P > 0.05) categories
Fig. 2
Fig. 2
Network analyses of nodes in various layers of AI-1MAIN. a Schematic illustration of network layering using the weighted k-shell decomposition method. Connected hypothetical network (left; gray nodes) and decomposed network into three shells (right; k = 1, k = 2, and k = 3 in green, red, and black colors) are shown. b Distribution of average degree of each shell from the innermost of the network (core) designated as 1 to the periphery of the network denoted as 1000 in AI-1MAIN. Effector targets and non-targets are shown in red and blue nodes, respectively (r2 = 0.67 and Mann–Whitney–Wilcoxon Test P < 2.2 × 10−16). c, d Average degree (Welch’s t-test P = 1.57 × 10−14) (c) and average betweenness (Welch’s t-test P = 4.27 × 10−12) (d) for internal layers AI-1MAIN proteins (red) and peripheral layers AI-1MAIN proteins (blue) are plotted. e Distribution of average information centrality (IC) for each shell starting from the core of the network in AI-1MAIN (r2 = 0.82 and Mann–Whitney–Wilcoxon test P < 2.2 × 10−16)
Fig. 3
Fig. 3
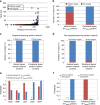
Functional properties of effector targets. a Distribution of effector targets (red) and non-targets (blue) within shells of AI-1MAIN encompassing varied sizes as well as locations with reference to the core indicated as 1. A shell index ranges from 1 to 1000 in logarithmic scale is demonstrated. b Percentage of effector targets (red) and non-targets (blue) in two categories of nodes, internal layers AI-1MAIN proteins and peripheral layers AI-1MAIN proteins, are displayed (hypergeometric P = 2.61 × 10−48). c, d Distribution of effector targets (red) and non-targets (blue) within shells of degree-preserving random network (c) and non-degree-preserving random network (d) are shown. e, f Phenotypic overrepresentation analyses among the nodes of effector targets (red) and non-targets (blue). Enrichment of CND (hypergeometric P = 0.05) and immune-related phenotypes (hypergeometric P = 2.55 × 10−6) in e and f, respectively for effector targets (red) are shown. Overrepresentation of no immune-related phenotypes in nodes located in peripheral layers are demonstrated (hypergeometric P = 0.035)
Fig. 4
Fig. 4
Experimental validation of the key proteins in CSILRR. a CSILRR network is organized using Edge-weighted spring embedded layout (left) and weighted k-shell decomposition analysis (right). Internal layers of CSILRR proteins are annotated to the right (red). Venn diagram shows the overlap of 23 out of 35 nodes belonging to internal layers of CSILRR with MTI subnetwork. b, c Distribution of average degree (r2 = 0.9, Mann–Whitney–Wilcoxon test P = 2.43 × 10−15) (b) and average information centrality (IC; c) (r2 = 0.93, Mann–Whitney–Wilcoxon test P < 2.2 × 10−16) for each shell laid out from the core to the periphery of CSILRR network. d Pairwise yeast two-hybrid (Y2H) experiment between kinase domains of 20 LRR-RKs and 31 effectors from Pseudomonas syringae pv. tomato DC3000. An equal amount of mated diploid yeast is spotted on minimum synthetic medium dropouts SD-LT (leucine and tryptophan), SD-LTH (leucine, tryptophan, and histidine), and SD-LH (leucine and histidine + cycloheximide). SD-LTH ansd SD-LH media were supplemented with 1 mM 3-Amino-1,2,4-Triazol (3AT). Positive and negative interactions are determined based on growth and no growth on SD-LTH and SD-LH media, respectively. The identity of an LRR-RK and a particular effector for an interacting pair is revealed. e Phenotypic enrichment analyses among the nodes of effector targets (red) and non-targets (blue) among LRR-RKs belong to internal and peripheral layers CSILRR proteins are shown (hypergeometric P < 0.05). f Split-YFP interaction assay in protoplasts derived from wild-type leaves. The percentage of positive cells was calculated by dividing the number of fluorescing cells by the total number of cells within an image (indicated values = mean ± S.E.M.; six biological replications). N designates the number of cells evaluated. Representative photos of the positive interactions are shown. The CD3−1089::ADF4 (Arabidopsis Actin Depolymerizing Factor 4) and CD3−1096::MBP (maltose binding protein of E. coli) interaction was used as a positive control. Empty CD3−1089 and CD3−1096 vectors were used as a negative control in each independent transformation
Fig. 5
Fig. 5
Immune-related functions of novel LRR-RKs in CSILRR. Bacterial growth of Pseudomonas syringae pv. tomato DC3000 (Pto DC3000, red bars) and effectorless mutant strain Pto DC3000 hrcC− (green bars) were quantified 3 days after syringe inoculation (OD600nm = 0.0002) on srf9 (a), apex (b), srf6-2 (c), rpk1 (d), nik3 (e), and nik1 as well as nik2 (f). Wild-type Col-0 plants were used as controls. Each dot in the box and whisker plot represents individual data points. n shows the number of leaf samples, and each sample contains four biological independent leaf discs. One-way ANOVA was performed to estimate statistical significance for bacteria growth. n.s. stands for not significant. *P < 0.05, **P < 0.01 and ***P < 0.001
Fig. 6
Fig. 6
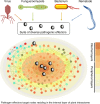
A model illustrating effector targets in plant interactome. Plant protein–protein interaction network (interactome) exhibiting direct physical interactions is demonstrated in the internal and the peripheral layers. Viral, fungal/oomycete, bacterial, and nematode pathogens delivering suite of pathogenic effectors are shown. A key to the color scheme representing the internal and the peripheral layers is revealed

Similar articles

Cited by

References

    1. Garbutt CC, Bangalore PV, Kannar P, Mukhtar MS. Getting to the edge: protein dynamical networks as a new frontier in plant-microbe interactions. Front. Plant Sci. 2014;5:312. doi: 10.3389/fpls.2014.00312. - DOI - PMC - PubMed
    1. Hu JX, Thomas CE, Brunak S. Network biology concepts in complex disease comorbidities. Nat. Rev. Genet. 2016;17:615–629. doi: 10.1038/nrg.2016.87. - DOI - PubMed
    1. Vidal M, Cusick ME, Barabasi AL. Interactome networks and human disease. Cell. 2011;144:986–998. doi: 10.1016/j.cell.2011.02.016. - DOI - PMC - PubMed
    1. McCormack ME, Lopez JA, Crocker TA, Mukhtar MS. Making the right connections: network biology and plant immune system dynamics. Curr. Plant Biol. 2016;5:2–12. doi: 10.1016/j.cpb.2015.10.002. - DOI
    1. Cho DY, Kim YA, Przytycka TM. Chapter 5: Network biology approach to complex diseases. PLoS Comput. Biol. 2012;8:e1002820. doi: 10.1371/journal.pcbi.1002820. - DOI - PMC - PubMed

Publication types

LinkOut - more resources