. 2018 Jun 13;8(1):9078.
doi: 10.1038/s41598-018-27401-5.

Hepatobiliary MRI: Signal intensity based assessment of liver function correlated to 13C-Methacetin breath test

Affiliations

Hepatobiliary MRI: Signal intensity based assessment of liver function correlated to 13C-Methacetin breath test

Michael Haimerl et al. Sci Rep. .

Abstract

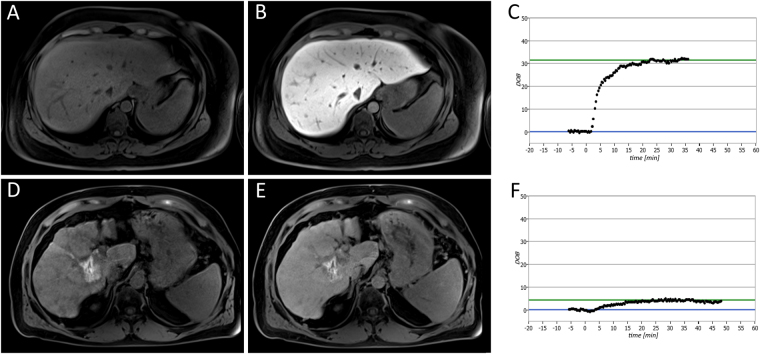
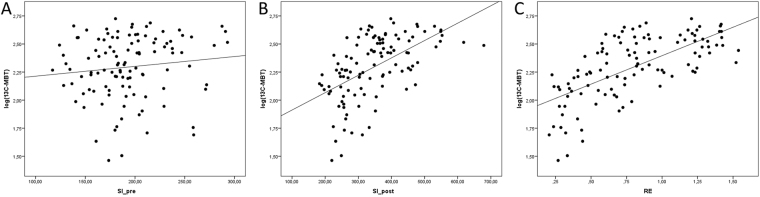
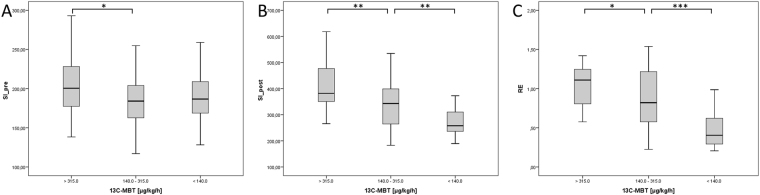
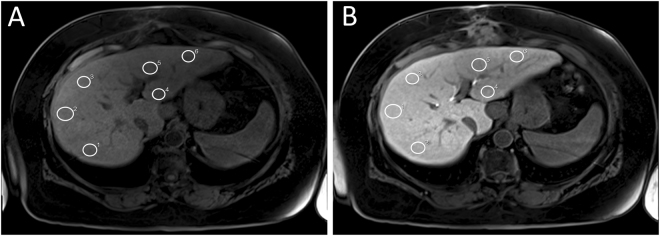
Gadoxetic acid (Gd-EOB-DTPA) is a paramagnetic MRI contrast agent with raising popularity and has been used for evaluation of imaging-based liver function in recent years. In order to verify whether liver function as determined by real-time breath analysis using the intravenous administration of 13C-methacetin can be estimated quantitatively from Gd-EOB-DTPA-enhanced MRI using signal intensity (SI) values. 110 patients underwent Gd-EOB-DTPA-enhanced 3-T MRI and, for the evaluation of liver function, a 13C-methacetin breath test (13C-MBT). SI values from before (SIpre) and 20 min after (SIpost) contrast media injection were acquired by T1-weighted volume-interpolated breath-hold examination (VIBE) sequences with fat suppression. The relative enhancement (RE) between the plain and contrast-enhanced SI values was calculated and evaluated in a correlation analysis of 13C-MBT values to SIpost and RE to obtain a SI-based estimation of 13C-MBT values. The simple regression model showed a log-linear correlation of 13C-MBT values with SIpost and RE (p < 0.001). Stratified by 3 different categories of 13C-MBT readouts, there was a constant significant decrease in both SIpost (p ≤ 0.002) and RE (p ≤ 0.033) with increasing liver disease progression as assessed by the 13C-MBT. Liver function as determined using real-time 13C-methacetin breath analysis can be estimated quantitatively from Gd-EOB-DTPA-enhanced MRI using SI-based indices.


Conflict of interest statement

The authors declare no competing interests.

Figures

Figure 1
Figure 1
Liver function analysis in patients with normal liver function (A,B,C) and severely impaired liver function (D,E,F). The patients underwent plain (A,D) and Gd-EOB-DTPA-enhanced HBP (B,E) T1-weighted VIBE sequences with fat suppression, as well as a 13C-MBT, over a maximum time span of 60 min (C,F). In the case of the displayed patients, a 13C-MBT readout value of 409 µg/kg/h (C) was considered normal liver function (SIpre, 182.67; SIpost, 441.67; RE, 1.42), while a 13C-MBT readout value of 57 µg/kg/h (F) was considered impaired liver function (SIpre, 258.50; SIpost, 332.83; RE, 0.29). The lesion observed in the liver with impaired function (D,E) was caused by former radiofrequency ablations treatments. The delta-over-baseline (DOB) was assessed inline automatically and describes the increase in the RPDB-corrected 13CO2:12CO2 ratio to the basal value (blue line). The evaluated 13C-MBT value was calculated as the product of the DOBmax, RPDB, CO2 production and molar mass of 13C-methacetin per body weight. The DOBmax (green line) was defined after an increase in DOB was no longer observable. At the time point 0, the 13C-methacetin was applied via bolus injection.
Figure 2
Figure 2
Correlation analysis of SI-based liver function indices to logarithmic values of 13C-MBT readout in scatterplots. The SI values obtained without contrast enhancement (SI_pre) show no predictive power for the logarithmic values of 13C-MBT (r = 0.213, p = 0.120; A), while the contrast-enhanced SI values (SI_post) show a significant correlation (r = 0.554, p < 0.001; B). A strong linear prediction of logarithmic 13C-MBT values can be observed for the relative enhancement (RE) values (r = 0.665, p < 0.001; C).
Figure 3
Figure 3
Boxplot analysis of SI-based indices separated by 13C-MBT readout categories. Native SI values (SI_pre; A) show no significant difference between the different 13C-MBT readout categories, except for Categories 1 and 2. SI values obtained after contrast enhancement (SI_post; B) and corrected by native SI values (RE; C) show significant differences among the 13C-MBT readout categories. *p < 0.05; **p < 0.01; ***p < 0.001.
Figure 4
Figure 4
Representative example of ROI placement in unenhanced (A) and Gd-EOB-DTPA-enhanced VIBE (B) scans of a patient with normal liver function. White circles mark ROIs manually placed at identical places in the right and left lobe of the liver.

Similar articles

Cited by

References

    1. Morris-Stiff G, Gomez D, Prasad R. Quantitative assessment of hepatic function and its relevance to the liver surgeon. J Gastrointest Surg. 2009;13:374–385. doi: 10.1007/s11605-008-0564-1. - DOI - PubMed
    1. Guglielmi A, Ruzzenente A, Conci S, Valdegamberi A, Iacono C. How much remnant is enough in liver resection? Dig Surg. 2012;29:6–17. doi: 10.1159/000335713. - DOI - PubMed
    1. Schreckenbach T, Liese J, Bechstein WO, Moench C. Posthepatectomy liver failure. Dig Surg. 2012;29:79–85. doi: 10.1159/000335741. - DOI - PubMed
    1. Candelli M, et al. 13C-methionine breath tests for mitochondrial liver function assessment. Eur Rev Med Pharmacol Sci. 2008;12:245–249. - PubMed
    1. Afolabi P, Wright M, Wootton SA, Jackson AA. Clinical utility of 13C-liver-function breath tests for assessment of hepatic function. Dig Dis Sci. 2013;58:33–41. doi: 10.1007/s10620-012-2340-z. - DOI - PubMed