. 2018 Jun;558(7710):454-459.
doi: 10.1038/s41586-018-0206-z. Epub 2018 Jun 13.

Induction and transcriptional regulation of the co-inhibitory gene module in T cells

Affiliations

Induction and transcriptional regulation of the co-inhibitory gene module in T cells

Norio Chihara et al. Nature. 2018 Jun.

Abstract

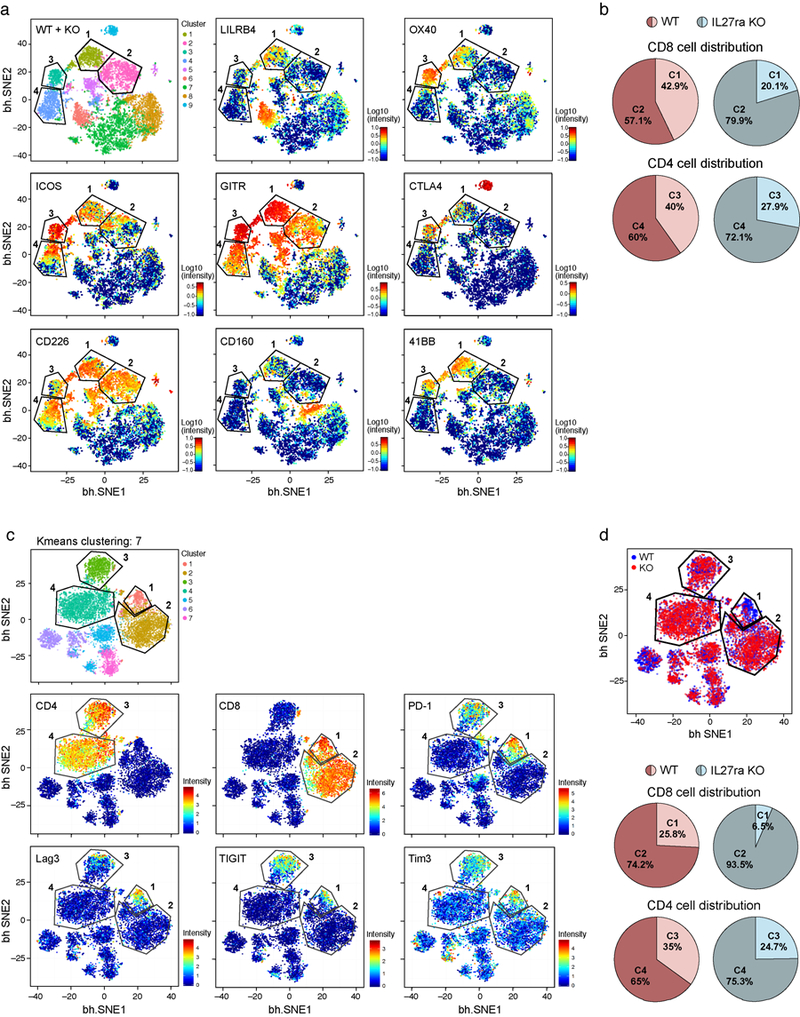
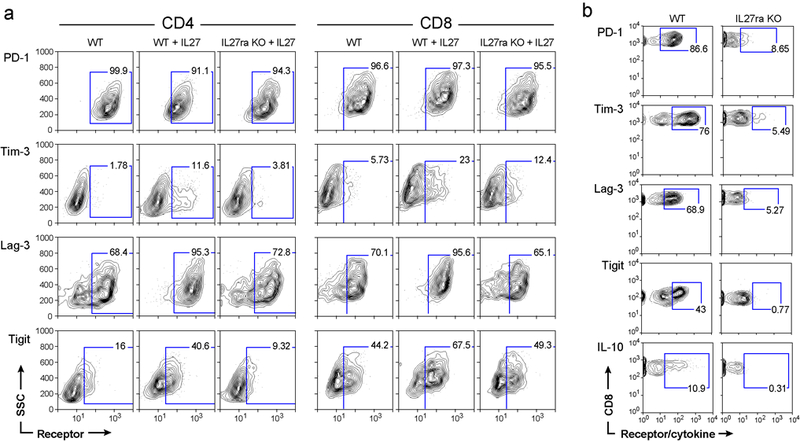
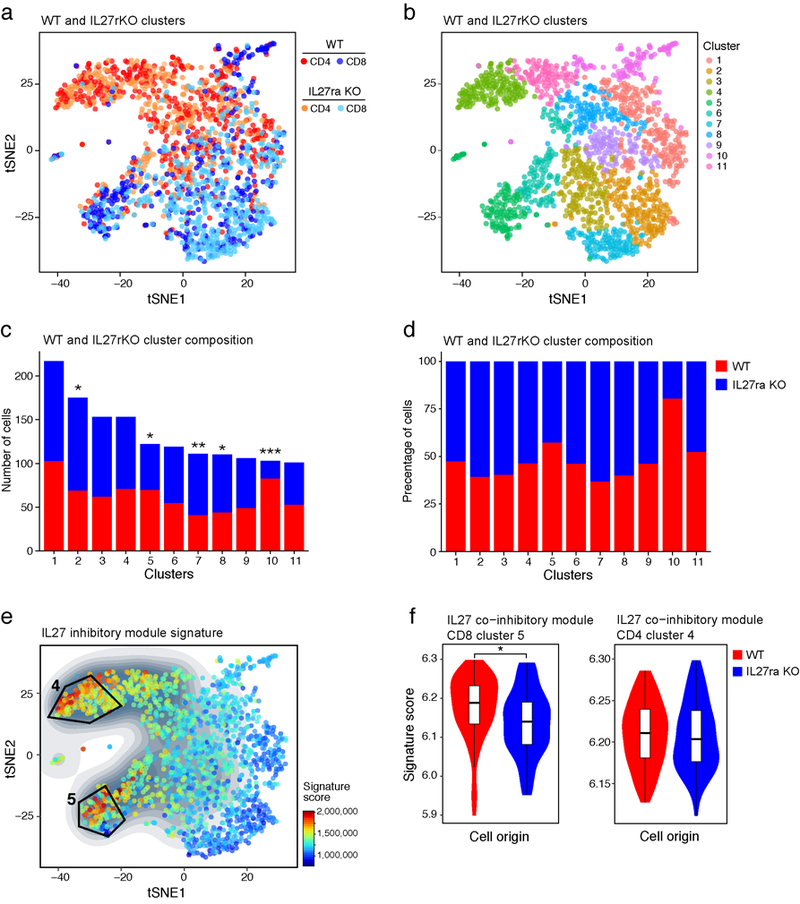
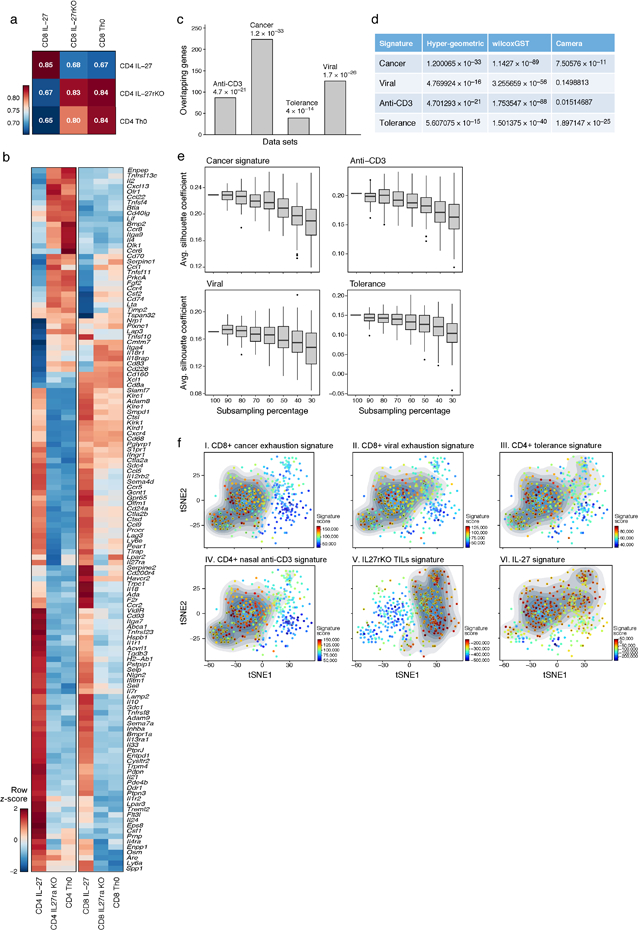
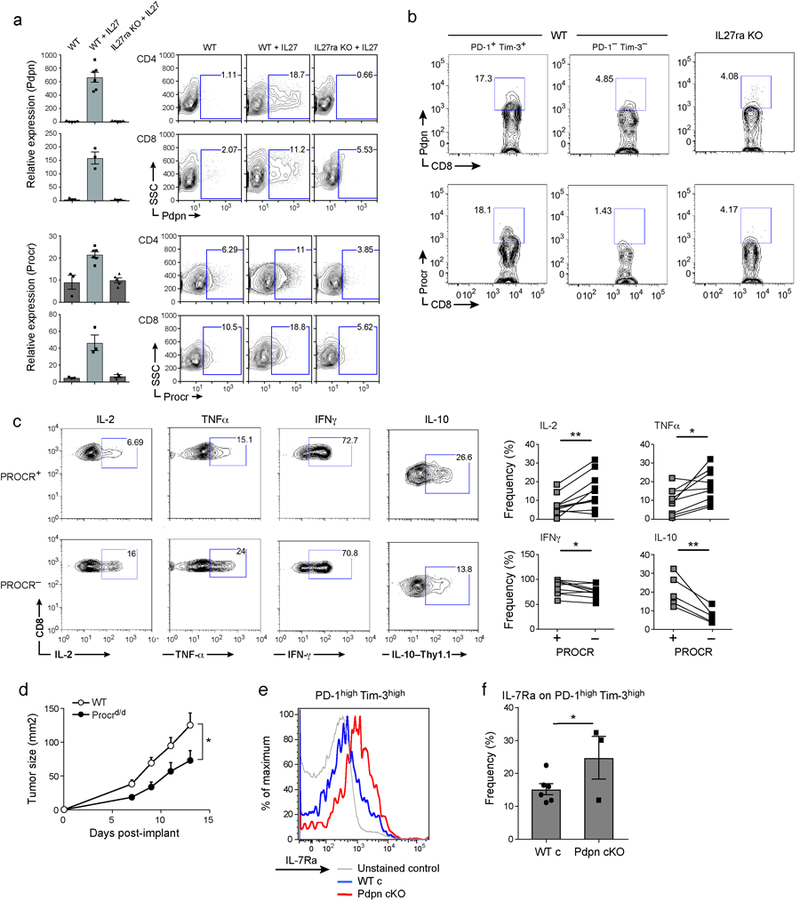
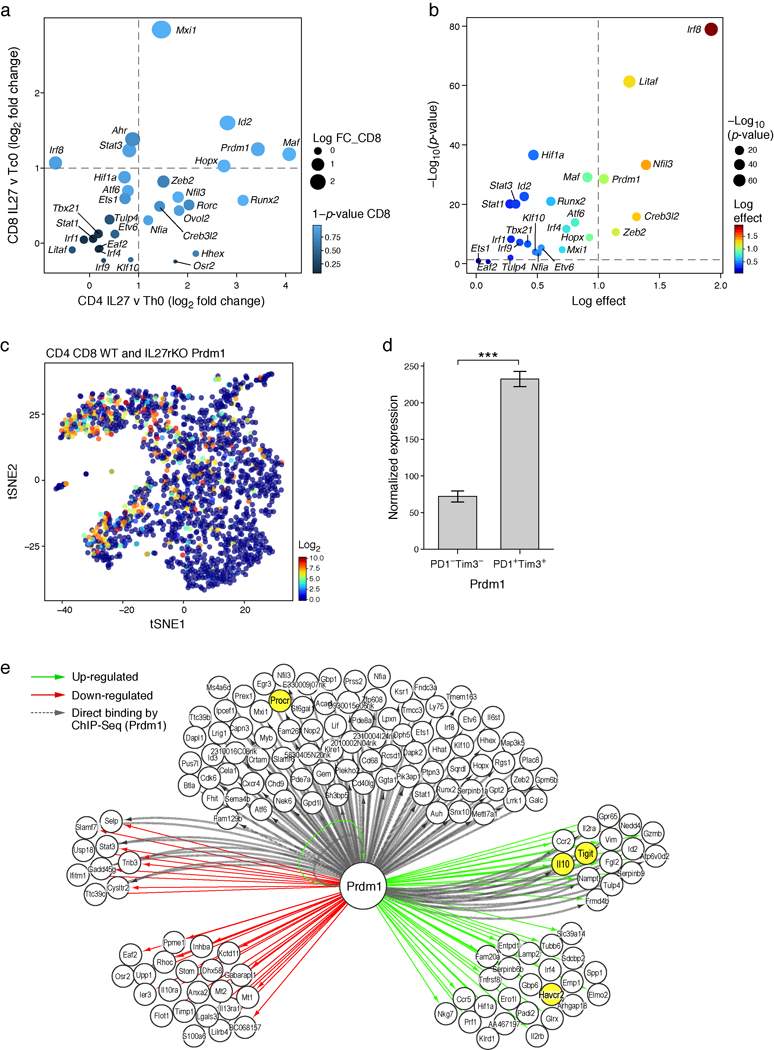
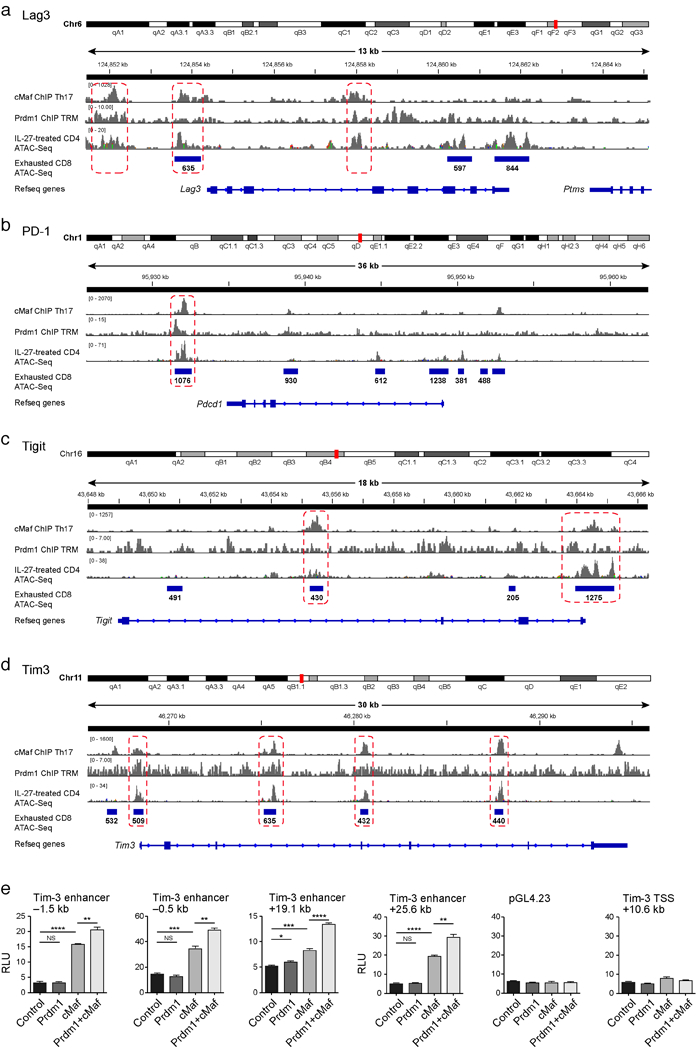
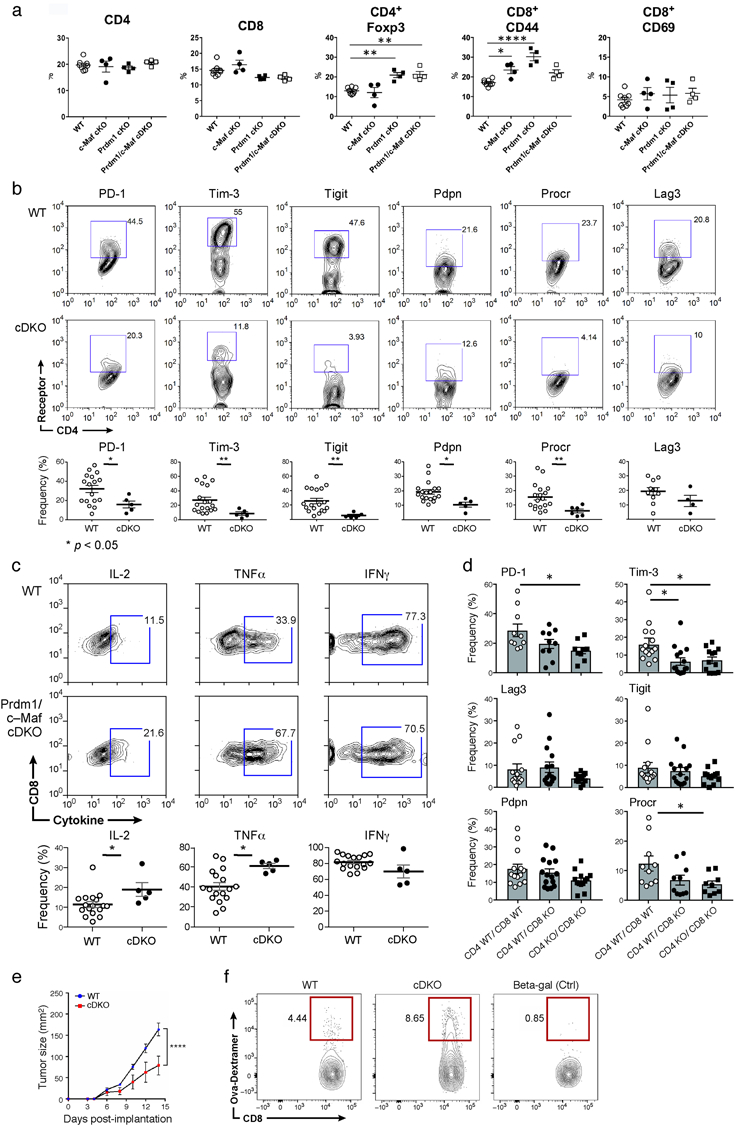
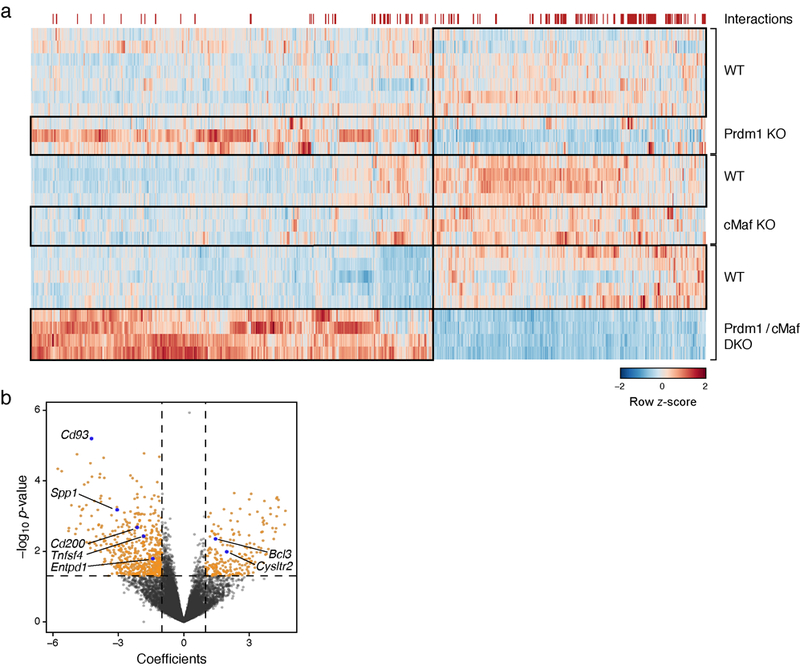
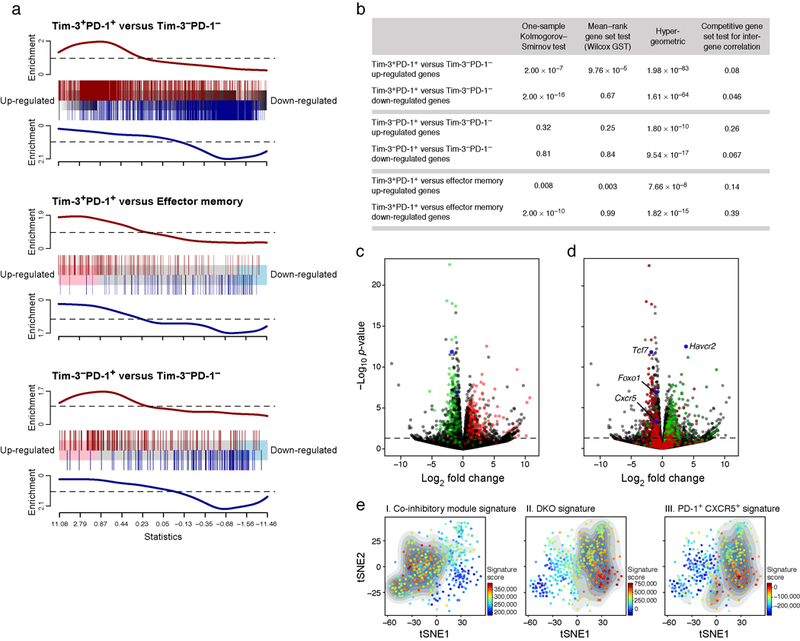
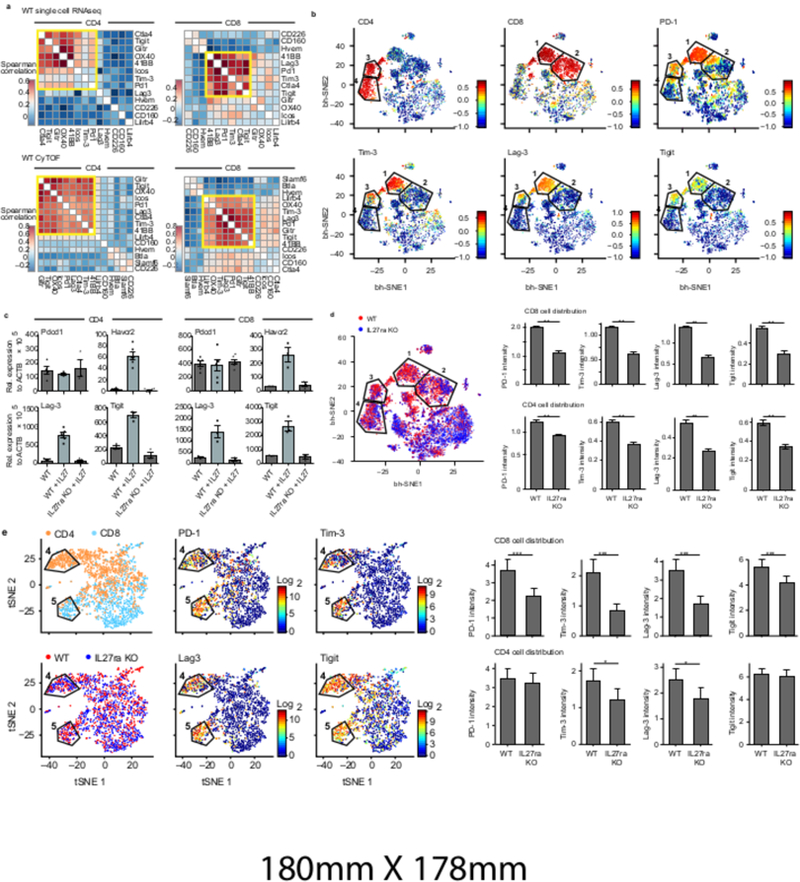
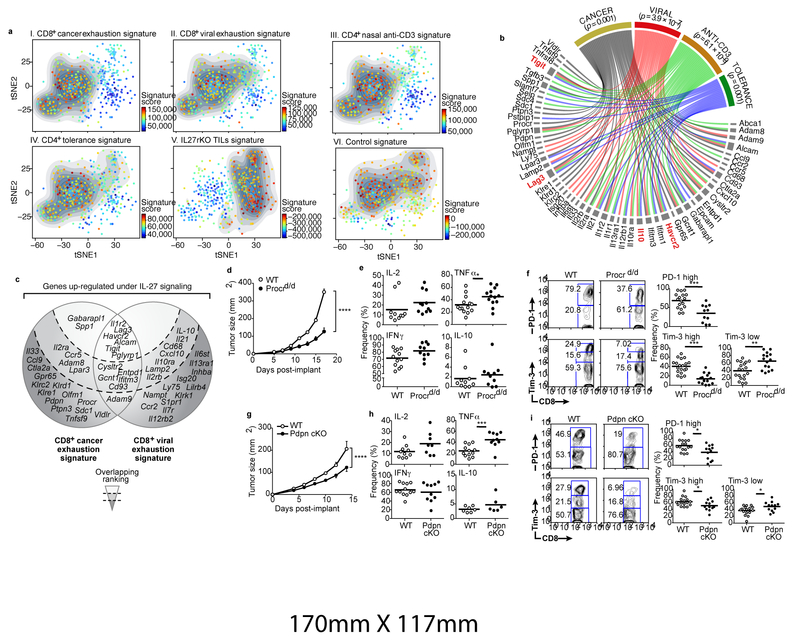
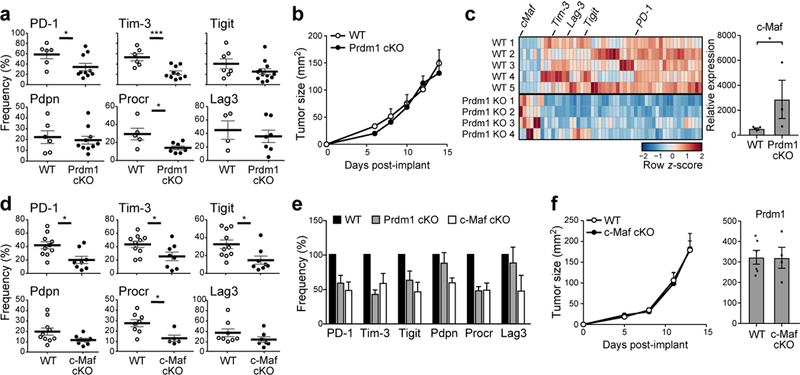
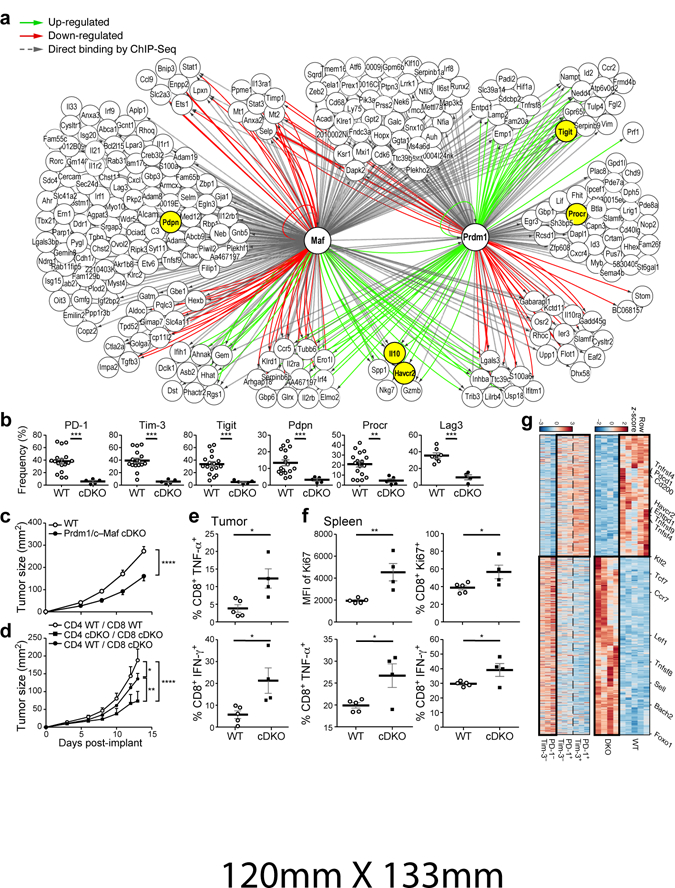
The expression of co-inhibitory receptors, such as CTLA-4 and PD-1, on effector T cells is a key mechanism for ensuring immune homeostasis. Dysregulated expression of co-inhibitory receptors on CD4+ T cells promotes autoimmunity, whereas sustained overexpression on CD8+ T cells promotes T cell dysfunction or exhaustion, leading to impaired ability to clear chronic viral infections and diseases such as cancer1,2. Here, using RNA and protein expression profiling at single-cell resolution in mouse cells, we identify a module of co-inhibitory receptors that includes not only several known co-inhibitory receptors (PD-1, TIM-3, LAG-3 and TIGIT) but also many new surface receptors. We functionally validated two new co-inhibitory receptors, activated protein C receptor (PROCR) and podoplanin (PDPN). The module of co-inhibitory receptors is co-expressed in both CD4+ and CD8+ T cells and is part of a larger co-inhibitory gene program that is shared by non-responsive T cells in several physiological contexts and is driven by the immunoregulatory cytokine IL-27. Computational analysis identified the transcription factors PRDM1 and c-MAF as cooperative regulators of the co-inhibitory module, and this was validated experimentally. This molecular circuit underlies the co-expression of co-inhibitory receptors in T cells and identifies regulators of T cell function with the potential to control autoimmunity and tumour immunity.


Conflict of interest statement

Conflict of Interest

A.C.A. is a member of the SAB for Potenza Therapeutics and Tizona Therapeutics. V.K.K. has an ownership interest and is a member of the SAB for Potenza Therapeutics and Tizona Therapeutics. A.C.A.’s and V.K.K.’s interests were reviewed and managed by the Brigham and Women’s Hospital and Partners Healthcare in accordance with their conflict of interest policies. A.R. is an SAB member for Thermo Fisher and Syros Pharmaceuticals and is a consultant for Driver Group.

Figures

Extended Data Figure 1.
Extended Data Figure 1.. CyTOF analysis of co-inhibitory and co-stimulatory receptor co-expression in TILs.
a) TILs were harvested from B16F10 melanoma tumor-bearing WT and IL27ra KO mice from Fig. 1b and analyzed using CyTOF (5000 cells from each). CyTOF data were analyzed using vi-SNE. Applying k-means clustering with (k=9) on the CyTOF data resulted in clear distinction between clusters 1, 2, 3 and 4. Polygons indicating clusters 1, 2 (in CD8+ T cells), 3 and 4 (in CD4+ T cells) are shown. Individual panels show expression of the indicated markers. b) Pie charts show the distribution of WT or IL27ra KO CD8+ and CD4+ TILs in clusters 1 and 2 (C1 and C2) of CD8+ TILs and clusters 3 and 4 (C3 and C4) of CD4+ TILs as defined in Fig. 1d. c) Independent data of WT and IL27ra KO TILs samples from that shown in Fig. 1 (5000 cells from each). Applying k-means clustering with (k=7) on the CyTOF data resulted in clear distinction between clusters 1, 2, 3 and 4. Polygons indicating clusters 1, 2 (in CD8+ T cells), 3 and 4 (in CD4+ T cells) are shown. d) vi-SNE plot highlighting the distribution of cells from WT (blue) and IL27ra KO (red) in CD8+ TILs clusters 1 and 2 and CD4+ TILs clusters 3 and 4. Pie charts show the distribution of WT or IL27ra KO CD8+ and CD4+ TILs in each cluster.
Extended Data Figure 2.
Extended Data Figure 2.. IL-27 induces multiple co-inhibitory receptors on CD4+ and CD8+ T cells.
a) Naïve T cells from WT or IL27ra KO mice were stimulated in vitro with anti-CD3/CD28 in the presence or absence of IL-27. Expression of co-inhibitory receptors was determined by flow cytometry. Representative data of 3 biologically independent experiments are shown. b) Expression of PD-1, Tim-3, Lag-3, TIGIT, and IL-10 on CD8+ TILs obtained from WT and IL27ra KO mice bearing B16F10 melanoma was determined by flow cytometry. Thy1.1-IL-10 reporter mice crossed with WT and IL27ra KO mice were used for IL-10 expression analysis. Representative data of 3 biologically independent experiments are shown.
Extended Data Figure 3.
Extended Data Figure 3.. Single-cell RNA-seq expression analysis of WT and IL27ra KO TILs.
a) TILs were harvested from B16F10 melanoma tumor-bearing WT (707 and 825 for CD4+ and CD8+ respectively) and IL27ra KO (376 and 394 for CD4+ and CD8+ respectively) mice as in Fig. 1e. t-SNE plot shows the presence of WT and IL27ra KO CD4+ and CD8+ TILs as indicated. b) Clustering using the Louvain-Jaccard method (40 nearest neighbors and 13 principal components). c) The composition of each cluster in terms of total number (c) and percentage (d) of WT (red) and IL27ra KO (blue) cells. P-values (*p-value<0.05, **p-value<0.01, ***p-value<0.001) were calculated using one sample t-test. e) Projection of the IL-27 co-inhibitory module signature on the single-cell RNA-seq data. The contour plot marks the region of highly expressing cells by taking into account only those cells that have an expression value above the mean. f) Violin and box plots displaying the distribution of the IL-27 co-inhibitory module signature score compared between WT (72 and 98 for CD4+ and CD8+ respectively) and IL27ra KO (85 and 77 for CD4+ and CD8+ respectively) cells in clusters 4 and 5 (CD4+ and CD8+ respectively, *p-value=0.01, one-sided t-test. The lower and upper hinges in the boxplot correspond to the first and third quartiles and the horizontal line corresponds to the median).
Extended Data Figure 4.
Extended Data Figure 4.. Overlap of the IL-27-induced gene program with signatures from four states of T cell impairment/tolerance/dysfunction.
a) Pearson correlation between WT CD4+ and CD8+ T cells for the 1,201 genes that were differentially expressed between WT CD4+ T cells stimulated in the presence or absence of IL-27 (FDR<0.05). b) Expression profile of 118 differentially expressed genes (from (a)) encoding cell surface receptors and cytokines are shown as a heatmap. c) The IL-27-induced gene program (1,201 genes) was compared to T cell signatures obtained from four states of T cell non-responsiveness. Number of overlapping genes between the IL-27 gene program and each signature is depicted. P values (***p < 0.001) were determined by hypergeometric test: Nasal anti-CD3 – 4.7×10⁻²¹, Cancer – 1.2 ×10⁻³³, antigen-specific tolerance – 4 ×10⁻¹⁴ and Viral exhaustion – 1.7 ×10⁻²⁶. d) p-value statistics for the significance of the overlap between the IL-27-induced gene program (1,201) and genes induced in other states of T cell non-responsiveness using wilcoxGST and camera. e) Gene signatures from (c) were sub-sampled and projected onto the CD8+ single-cell TILs data. Changes were quantified by randomly selecting decreasing subsets of genes from each signature and calculating the average silhouette width of cells that scored high for the different generated signatures based on Euclidian distance between the principal component values used to generate the tSNE plot. The lower and upper hinges in the boxplot correspond to the first and third quartiles and the horizontal line corresponds to the median (Methods). f) Panels I-V, tSNE plots of the 588 CD8+ single-cell TILs (dots) harvested from WT mice bearing B16F10 melanoma tumor. Cells are colored in each panel by their signature score. The score reflects the relative average expression of the genes in the overlap of the IL-27 gene signature with the signatures for each of the indicated states of T cell non-responsiveness. Panel VI is a projection of a signature of the differentially expressed genes between CD8+ TILs from WT and IL27ra KO mice bearing B16 melanomas (Methods). The contour plot marks the region of highly scored cells by taking into account only those cells that have a signature score above the mean score. Cells that had a statistically significant score (adjusted p-value<0.05) were marked by ‘+’ (Methods).
Extended Data Figure 5.
Extended Data Figure 5.. Characterization of the role of Pdpn and Procr in CD8+ TILs
a) Pdpn and Procr protein and mRNA expression was determined in T cells from WT and IL27ra KO stimulated with anti-CD3/CD28 in the presence or absence of IL-27. CD4+ cells were analyzed at 96hr and CD8+ cells at 72hr. Data are representative flow cytometry and qPCR data from biologically independent animals. mean + s.e.m is shown. b) Representative flow cytometry data of 3 independent experiments showing Pdpn and Procr expression in PD-1+Tim-3+ CD8+ and PD-1-Tim-3- CD8+ TILs obtained from WT and IL27ra KO mice bearing B16F10 melanoma. c) TILs from WT mice bearing B16F10 melanoma were stimulated with PMA and Ionomycin. Cytokine production in Procr+ or Procr- CD8+ TILs is shown. Thy1.1-IL-10 reporter mice were used for IL-10 expression analysis. Data are from biologically independent animals. mean + s.e.m is shown. *p < 0.05; **p < 0.01, paired t-test. d) 5×10⁵ CD8+ T cells from wild type or Procrd/d mice were transferred along with 1×10⁶ wild type CD4+ T cells to Rag1 KO mice (N=5). On day 2, 5×10⁵ B16F10 cells were implanted. Mean tumor size + s.e.m is shown. *P<0.05, repeated measures ANOVA, Sidak’s multiple comparisons test. e) TILs were obtained from WT and Pdpn cKO mice bearing B16F10 melanoma and stained for the expression of IL-7Ra. Representative flow cytometry data from 3 independent animals. f) Summary data of IL-7Ra expression are from biologically independent animals. mean + s.e.m is shown. *p < 0.05, one-sided t-test.
Extended Data Figure 6.
Extended Data Figure 6.. Prdm1 is a candidate regulator of the co-inhibitory module.
a) Log2 fold change RNA levels between naïve CD4+ or CD8+ T cells simulated with or without IL-27. Data are from two independent experiments. Shown are transcription factors that are part of the IL-27 co-inhibitory module (Differentially expressed transcription factors were annotated as genes with FDR-corrected ANOVA <0.05). b) Transcription factors that are both in the IL-27 co-inhibitory module and are also overexpressed in clusters 4 and 5 in the single-cell data (clusters that were enriched for the IL-27 signature, Extended data Fig. 3e,f). Differentially expressed genes between clusters 4/5 and the rest of the clusters were determined using binomcount.test (binomial distribution, Methods). Log effect corresponds to log proportion of expressing cells and p-value is calculated by the probability of finding n or more cells positive for the gene in clusters 4/5 given the fraction in the rest of the clusters. c) tSNE plot of Fig. 1e. showing the expression of Prdm1 in WT (707 and 825 for CD4+ and CD8+, respectively) and IL27ra KO (376 and 394 for CD4+ and CD8+, respectively) cells. d) Normalized RNA expression levels of Prdm1 in PD-1-Tim-3- (n=3) and PD-1+Tim-3+ (n=3) CD8+ TILs (mean + s.e. is shown, ***p = 0.0004, two-sided t-test). e) Network model based on RNAseq gene expression data of naïve CD8+ T cells from Prdm1fl/fl (WT) or CD4crePrdm1fl/fl (Prdm1 cKO) mice stimulated in the presence of IL-27 and actual binding events (ChIPseq) data for Prdm1. Green arrows designate genes up-regulated by Prdm1, red arrows designate genes down-regulated by Prdm1, and dashed gray arrows mark binding events.
Extended Data Figure 7.
Extended Data Figure 7.. Genomic tracks surrounding the co-inhibitory molecules
Lag3 (a), Pd-1 (b), Tigit (c) and Tim-3 (d) with overlay of Chipseq data of Prdm1 and c-Maf and ATACseq data of naïve CD4+ cells induced with IL27 for 72h and ATACseq data of CD8+ T cells 27 days following chronic viral infection. Regions of binding sites common to both Prdm1 and c-Maf are indicated by the dotted rectangles. e) Luciferase activity in 293T cells transfected with pGL4.23 luciferase reporters for depicted enhancers of Tim-3 together with empty vector (control), constructs encoding Prdm1, c-Maf, or both. Firefly luciferase activity was measured 48h after transfection and is presented relative to constitutive Renilla luciferase activity.
Extended Data Figure 8.
Extended Data Figure 8.. Immune characterization of Prdm1 cKO, cMaf cKO, and Prdm1/c-Maf cDKO before and after tumor challenge.
a) Analysis of steady-state immune system in WT, c-Maf cKO, Prdm1 cKO, and Prdm1/c-Maf cDKO. Summary data for CD4, CD8, Foxp3, CD44, CD62L, and CD69 expression in spleen from WT, c-Maf cKO, Prdm1 cKO andPrdm1/c-Maf cDKO mice. Data are from biologically independent animals. mean + s.e.m is shown. *p < 0.05; **p <0.01; ****p < 0.0001, one-way ANOVA and Tukey’s multiple comparisons test. b) co-inhibitory receptor expression in CD4+ TILs from Prdm1/c-Maf cDKO mice. Top panels, representative flow cytometry data from 3 independent experiments for TILs from WT and Prdm1/c-Maf cDKO stained for PD-1, Tim-3, TIGIT, Pdpn, and Procr expression. Bottom panels show summary data. Data are from biologically independent animals. mean + s.e.m is shown *p < 0.05, two-sided t-test. c) Top panels, representative flow cytometry data from 3 independent experiments showing cytokine production from CD8+ TILs from WT and cDKO bearing B16F10 melanoma. Bottom panels, summary data. Data are from biologically independent animals. mean + s.e.m is shown. *p < 0.05, two-sided t-test. d) Co-inhibitory receptor expression on CD8+ TILs sorted from B16-OVA-bearing Rag1 KO mice that were transferred with Prdm1/c-Maf cDKO (n=4) or wild type (n=4) CD4+ and CD8+ T cells as indicated. Data are from biologically independent animals. mean + s.e.m is shown. *P<0.05, one-way ANOVA and Tukey’s multiple comparisons test. e) Rag1 KO mice were transferred with either wildtype or cDKO CD4+ and CD8+ (2:1 CD4:CD8 ratio) followed by subcutaneous injection of MC38-OVA. Mean tumor size + s.e.m is shown. ****P<0.0001, repeated measures ANOVA, Sidak’s multiple comparisons test. On Day 14 post tumor implantation mice were sacrificed and TILs, spleen and draining Lymph nodes were harvested. f) The frequency of antigen specific CD8+ T cells in the dLN of mice in (e).
Extended Data Figure 9.
Extended Data Figure 9.. Examination of additive and non-additive (synergistic) effects of Prdm1 and c-Maf.
a) A Heatmap showing all 940 DE genes between WT (n=5) and cDKO (Prdm1/c-Maf, n=4) and their expression in single KO (Prdm1 control n=7, Prdm1 KO n=3, cMaf control n=4 and cMaf KO n=3) mice. The red markings on the top of the heatmap indicate genes on whose expression the two knockouts have a statistically significant (p-value<0.05) non-additive effect in the cDKO (149 out of 940 DE genes). b) Volcano plot of the same analysis as in (a) for global gene expression. Genes whose expression in the two single knockouts have a statistically significant (p-value<0.05) non-additive effect in the cDKO (1144 out of 12,906 genes) and had abs (coefficient)>1 (779 out of 1144) are shown in orange.
Extended Data Figure 10.
Extended Data Figure 10.. Comparison of gene expression between Prdm1/c-Maf cDKO TILs and CD8+ TILs populations from wild type mice.
a) Barcode enrichment plot displaying two gene sets in a ranked gene list. The ranked gene list was defined as fold change in gene expression between Prdm1/c-Maf cDKO and WT CD8+ TILs. The three gene sets consist of differentially expressed genes between: PD-1+Tim-3+ CD8+ (DP, n=3) and PD-1-Tim-3- CD8+ (DN, n=3) TILs, PD-1+Tim-3+ CD8+ (DP) TILs and Memory CD8+ (n=3), and PD-1+Tim-3- CD8+ (SP, n=3) and PD-1-Tim-3- CD8+ (DN) TILs. b) This analysis was followed by four statistical tests (one-sample Kolmogorov-Smirnov test, mean-rank gene set test (wilcoxGST), hypergeometric, and competitive gene set test accounting for inter-gene correlation) for enrichment of these signatures in the cDKO expression profile. c) WT versus cDKO volcano plot. Green indicates genes that were up-regulated in the PD-1-Tim-3- CD8+ (DN) TILs and red indicates genes that were up-regulated in the PD-1+Tim-3+ CD8+ (DP) TILs. d) WT versus cDKO volcano plot. Red indicates genes that were up-regulated in PD-1+CXCR5+CD8+ T cells and green indicates genes that were up-regulated in PD-1+CXCR5-CD8+ T cells in chronic LCMV infection. e). A tSNE plot of the 588 CD8+ TILs harvested from WT mice bearing B16F10 melanoma tumors, colored by the relative signature score for the co-inhibitory module (272 genes, Supplementary Information Table 2), the cDKO signature (shown in (g)), and the PD-1+CXCR5+CD8+ T cell signature from chronic virus infection. The contour plot marks the region of highly scored cells by taking into account only those cells that have a signature score above the mean.
Figure 1.
Figure 1.. Multiple co-inhibitory receptors are expressed as a module on CD4+ and CD8+ T cells
a) CD4+ and CD8+ tumor-infiltrating lymphocytes (TILs) were harvested from WT mice bearing B16F10 melanoma tumors. Top panels, co-expression analysis of co-inhibitory and co-stimulatory receptor mRNA expression as determined by single-cell RNA-seq for 316 CD4+ and 588 CD8+ TILs. Bottom panels, protein expression by CyTOF for 23,656 CD4+ and 36,486 CD8+ TILs. Spearman correlation, followed by dendrogram ordering of the matrix using Euclidian distance is shown. Data are from biologically independent experiments. b) TILs from WT mice bearing B16F10 melanoma were analyzed using CyTOF with a custom panel of antibodies against co-inhibitory and co-stimulatory cell surface receptors, (Supplementary Information Table 1). Data were analyzed using vi-SNE. Polygons indicating clusters 1, 2 (in CD8+ T cells), 3 and 4 (in CD4+ T cells) are shown. Individual panels show expression of the indicated markers. c) Naïve T cells from either wild type (WT) or IL-27ra deficient (IL27ra KO) mice were stimulated with anti-CD3/CD28 in the presence or absence of IL-27. Indicated co-inhibitory receptors expression was examined by real-time PCR (qPCR) at 96hr (CD4) and 72hr (CD8). Data are from biologically independent animals. mean + s.e.m is shown. d) vi-SNE plot showing WT (red) and IL27ra KO (blue) cells. e) ScRNA-seq of TILs from mice bearing B16F10 melanoma. Data were analyzed using t-SNE. Polygons indicating cluster 4 (in CD4+ T cells, orange) and cluster 5 (in CD8+ T cells, blue) are shown. Individual panels show expression of the indicated markers. Bar graphs show the mean signal intensity for indicated co-inhibitory receptors from WT (CD4+ (n=849); CD8+ (n=1752)) and IL27ra KO (CD4+ (n=628); CD8+ (n=541)) TILs for CyTOF (d) or WT (CD4+ (n=707); CD8+ (n=825)) and IL27ra KO (CD4+ (n=376); CD8+ (n=394)) TILs for ScRNA-seq (e). Error bars indicate s.e.m. and *p < 0.05, **p < 0.01, ***p < 0.001; two-sided t-test.
Figure 2.
Figure 2.. The IL-27-induced gene program overlaps with multiple signatures of T cell dysfunction and tolerance
a) Panels I-VI, tSNE plots of the 588 CD8+ single-cell TILs (dots) harvested from WT mice bearing B16F10 melanoma. Cells are colored in each panel by their signature score that reflects the relative average expression of the genes in the overlap of the IL-27-induced gene program with the signatures for each of the indicated states of T cell non-responsiveness. Panel VI is a projection of a signature of the differentially expressed genes between CD8+ TILs from WT and IL27ra KO mice bearing B16 melanoma (Methods). The contour marks the region of highly scored cells based on cells with signature scores above the mean. b) Graphical representation of the overlap of 57 IL-27-induced cell surface receptors or cytokine genes with genes expressed in different states of T cell non-responsiveness. The width of the gray bars reflects the extent of overlap across states. Significance of the overlap genes between the IL-27 induced and each state of T cell non-responsiveness state were calculated using Wilcox GST and camera. c) Graphical representation of the selected overlap genes between the cancer exhaustion and the chronic viral exhaustion signatures. The shaded background reflects the ranking based on the extent of overlap with the T cell states depicted. d) WT (n=8) mice and Procrd/d (n=7) or g) WT (n=5) and Pdpn cKO (n=5) mice were implanted with B16F10 melanoma. Data are from 3 biologically independent experiments. Mean tumor size + s.e.m is shown. ****P<0.0001, repeated measures ANOVA, Sidak’s multiple comparisons test. e and h) Summary of flow cytometry data for cytokine production in the indicated CD8+ TILs. f and i) Left panels, representative flow cytometry data for Tim-3 and PD-1 expression on the indicated CD8+ TILs. Right panels, summary data. e-i) *p < 0.05; **p < 0.01; ***p < 0.001, two-sided t-test.
Figure 3.
Figure 3.. Prdm1 and c-Maf individually regulate co-inhibitory receptors on T cells
a) Summary data of co-inhibitory receptor expression on CD8+ TILs from WT and Prdm1 cKO mice bearing B16F10 melanoma. Data are from biologically independent animals. mean + s.e.m is shown. *p<0.05, ***p<0.001, two-sided t-test. b) WT (n=5) and Prdm1 cKO (n=5) mice were implanted with B16F10 melanoma. Mean tumor size + s.e.m. is shown. Data are from 3 biologically independent experiments. c) Left panel, gene expression in CD8+ TILs from WT and Prdm1 cKO mice bearing B16F10 melanoma was analyzed by n-counter code-set (Supplementary Information Table 3). Differentially expressed genes are shown as a heatmap. Right panel, expression of c-Maf in CD8+ TILs from WT and Prdm1 cKO mice as determined by qPCR. Data are from biologically independent animals. mean + s.e.m is shown. p = 0.03, two-sided t-test. d) Summary data of co-inhibitory receptor expression on CD8+ TILs from WT and c-Maf cKO. Data are from biologically independent animals. mean + s.e.m is shown. *p < 0.05, two-sided t-test. e) Frequency of co-inhibitory receptor expression of Prdm1 cKO (gray bar) and c-Maf cKO (open bar) CD8+ TILs relative to WT (filled bar). Data are from 3a and 3d, mean + s.e.m is shown. f) Left panel, WT (n=8) and c-Maf cKO (n=5) mice were implanted with B16F10 melanoma. Mean tumor size + s.e.m is shown. Data are from two biologically independent experiments. Right panel, expression of Prdm1 in CD8+ TILs from WT and c-Maf cKO mice as determined by qPCR.
Figure 4.
Figure 4.. Prdm1 and c-Maf together regulate a co-inhibitory gene module that determines anti-tumor immunity
a) Network model based on coupling RNAseq gene expression data of naïve CD8+ T cells from Prdm1 cKO or c-Maf cKO mice stimulated in the presence of IL-27 and Prdm1 and c-Maf ChIPseq data. Up-regulated genes (green arrows), down-regulated genes (red arrows), and c-Maf or Prdm1 binding events (gray arrows) are shown. b) Summary data of indicated co-inhibitory receptors expression on CD8+ TILs from WT and Prdm1/c-Maf cDKO bearing B16F10 melanoma. Data are from biologically independent animals. mean + s.e.m is shown. **p < 0.01; ***p < 0.001, two-sided t-test. c) WT (n=15) and cDKO (n=8) mice were implanted with B16F10 melanoma. Data shown are from 3 biologically independent experiments. d) CD4+ or CD8+ T cells sorted from cDKO mice or littermate controls were transferred into Rag1 KO mice at a 2:1 CD4:CD8 ratio followed by subcutaneous injection of B16-OVA (n=5, each condition). Data are representative of 3 biologically independent experiments. c-d) Mean tumor size + s.e.m is shown. *P<0.05, **P<0.01, ****P<0.0001, repeated measures ANOVA, Sidak’s multiple comparisons test. e–f) T cells were harvested from Rag1 KO mice that received an adoptive transfer of CD4+ and CD8+ T cells from WT or cDKO mice (2:1 CD4:CD8 ratio) followed by subcutaneous injection of MC38-OVA (Extended Data Fig. 8e). e) The frequency of IFN-γ and TNF- α CD8+ TILs after OVA-peptide stimulation, f) the frequency and expression of Ki67+ cells on splenocytes (upper panel), and the frequency of IFN-γ and TNF-α CD8+ splenocytes (lower panel) after OVA-peptide stimulation. mean + s.e.m is shown. Data are from biologically independent animals. *P<0.05, **P<0.01, two-sided t-test. g) 940 differentially expressed genes between CD8+ TILs from WT and cDKO bearing B16F10 melanoma. (adj. P. value<0.05, likelihood ratio test and FDR correction) (top panel) and their corresponding expression pattern in PD-1+Tim-3+ CD8+, PD-1+Tim-3- CD8+, and PD-1-Tim-3- CD8+ TILs.

References

    1. Wherry EJ & Kurachi M Molecular and cellular insights into T cell exhaustion. Nature reviews. Immunology 15, 486–499, 10.1038/nri3862 (2015). - DOI - PMC - PubMed
    1. Anderson AC, Joller N & Kuchroo VK Lag-3, Tim-3, and TIGIT: Co-inhibitory Receptors with Specialized Functions in Immune Regulation. Immunity 44, 989–1004, 10.1016/j.immuni.2016.05.001 (2016). - DOI - PMC - PubMed
    1. Singer M et al. A Distinct Gene Module for Dysfunction Uncoupled from Activation in Tumor-Infiltrating T Cells. Cell 166, 1500–1511 e1509, 10.1016/j.cell.2016.08.052 (2016). - DOI - PMC - PubMed
    1. Maaten L HG Visualizing Data using t-SNE. Journal of Machine Learning Research, 2579–2605 (2008).
    1. Fitzgerald DC et al. Suppression of autoimmune inflammation of the central nervous system by interleukin 10 secreted by interleukin 27-stimulated T cells. Nature immunology 8, 1372–1379, 10.1038/ni1540 (2007). - DOI - PubMed
References for Method and Extended Data
    1. Blondel VD, Guillaume JL, Lambiotte R & Lefebvre E Fast unfolding of communities in large networks. J. Stat. Mech, P10008 (2008).
    1. Wende H et al. The transcription factor c-Maf controls touch receptor development and function. Science 335, 1373–1376, 10.1126/science.1214314 (2012). - DOI - PubMed
    1. Smyth GK Linear models and empirical bayes methods for assessing differential expression in microarray experiments. Statistical applications in genetics and molecular biology 3, Article3, 10.2202/1544-6115.1027 (2004). - DOI - PubMed
    1. Reich M et al. GenePattern 2.0. Nat Genet 38, 500–501, 10.1038/ng0506-500 (2006). - DOI - PubMed
    1. Tirosh I et al. Dissecting the multicellular ecosystem of metastatic melanoma by single-cell RNA-seq. Science 352, 189–196, 10.1126/science.aad0501 (2016). - DOI - PMC - PubMed

Publication types

MeSH terms

Substances