. 2018 Jun;558(7711):553-558.
doi: 10.1038/s41586-018-0215-y. Epub 2018 Jun 13.

Cryo-EM structure of human rhodopsin bound to an inhibitory G protein

Affiliations

Cryo-EM structure of human rhodopsin bound to an inhibitory G protein

Yanyong Kang et al. Nature. 2018 Jun.

Erratum in

Abstract

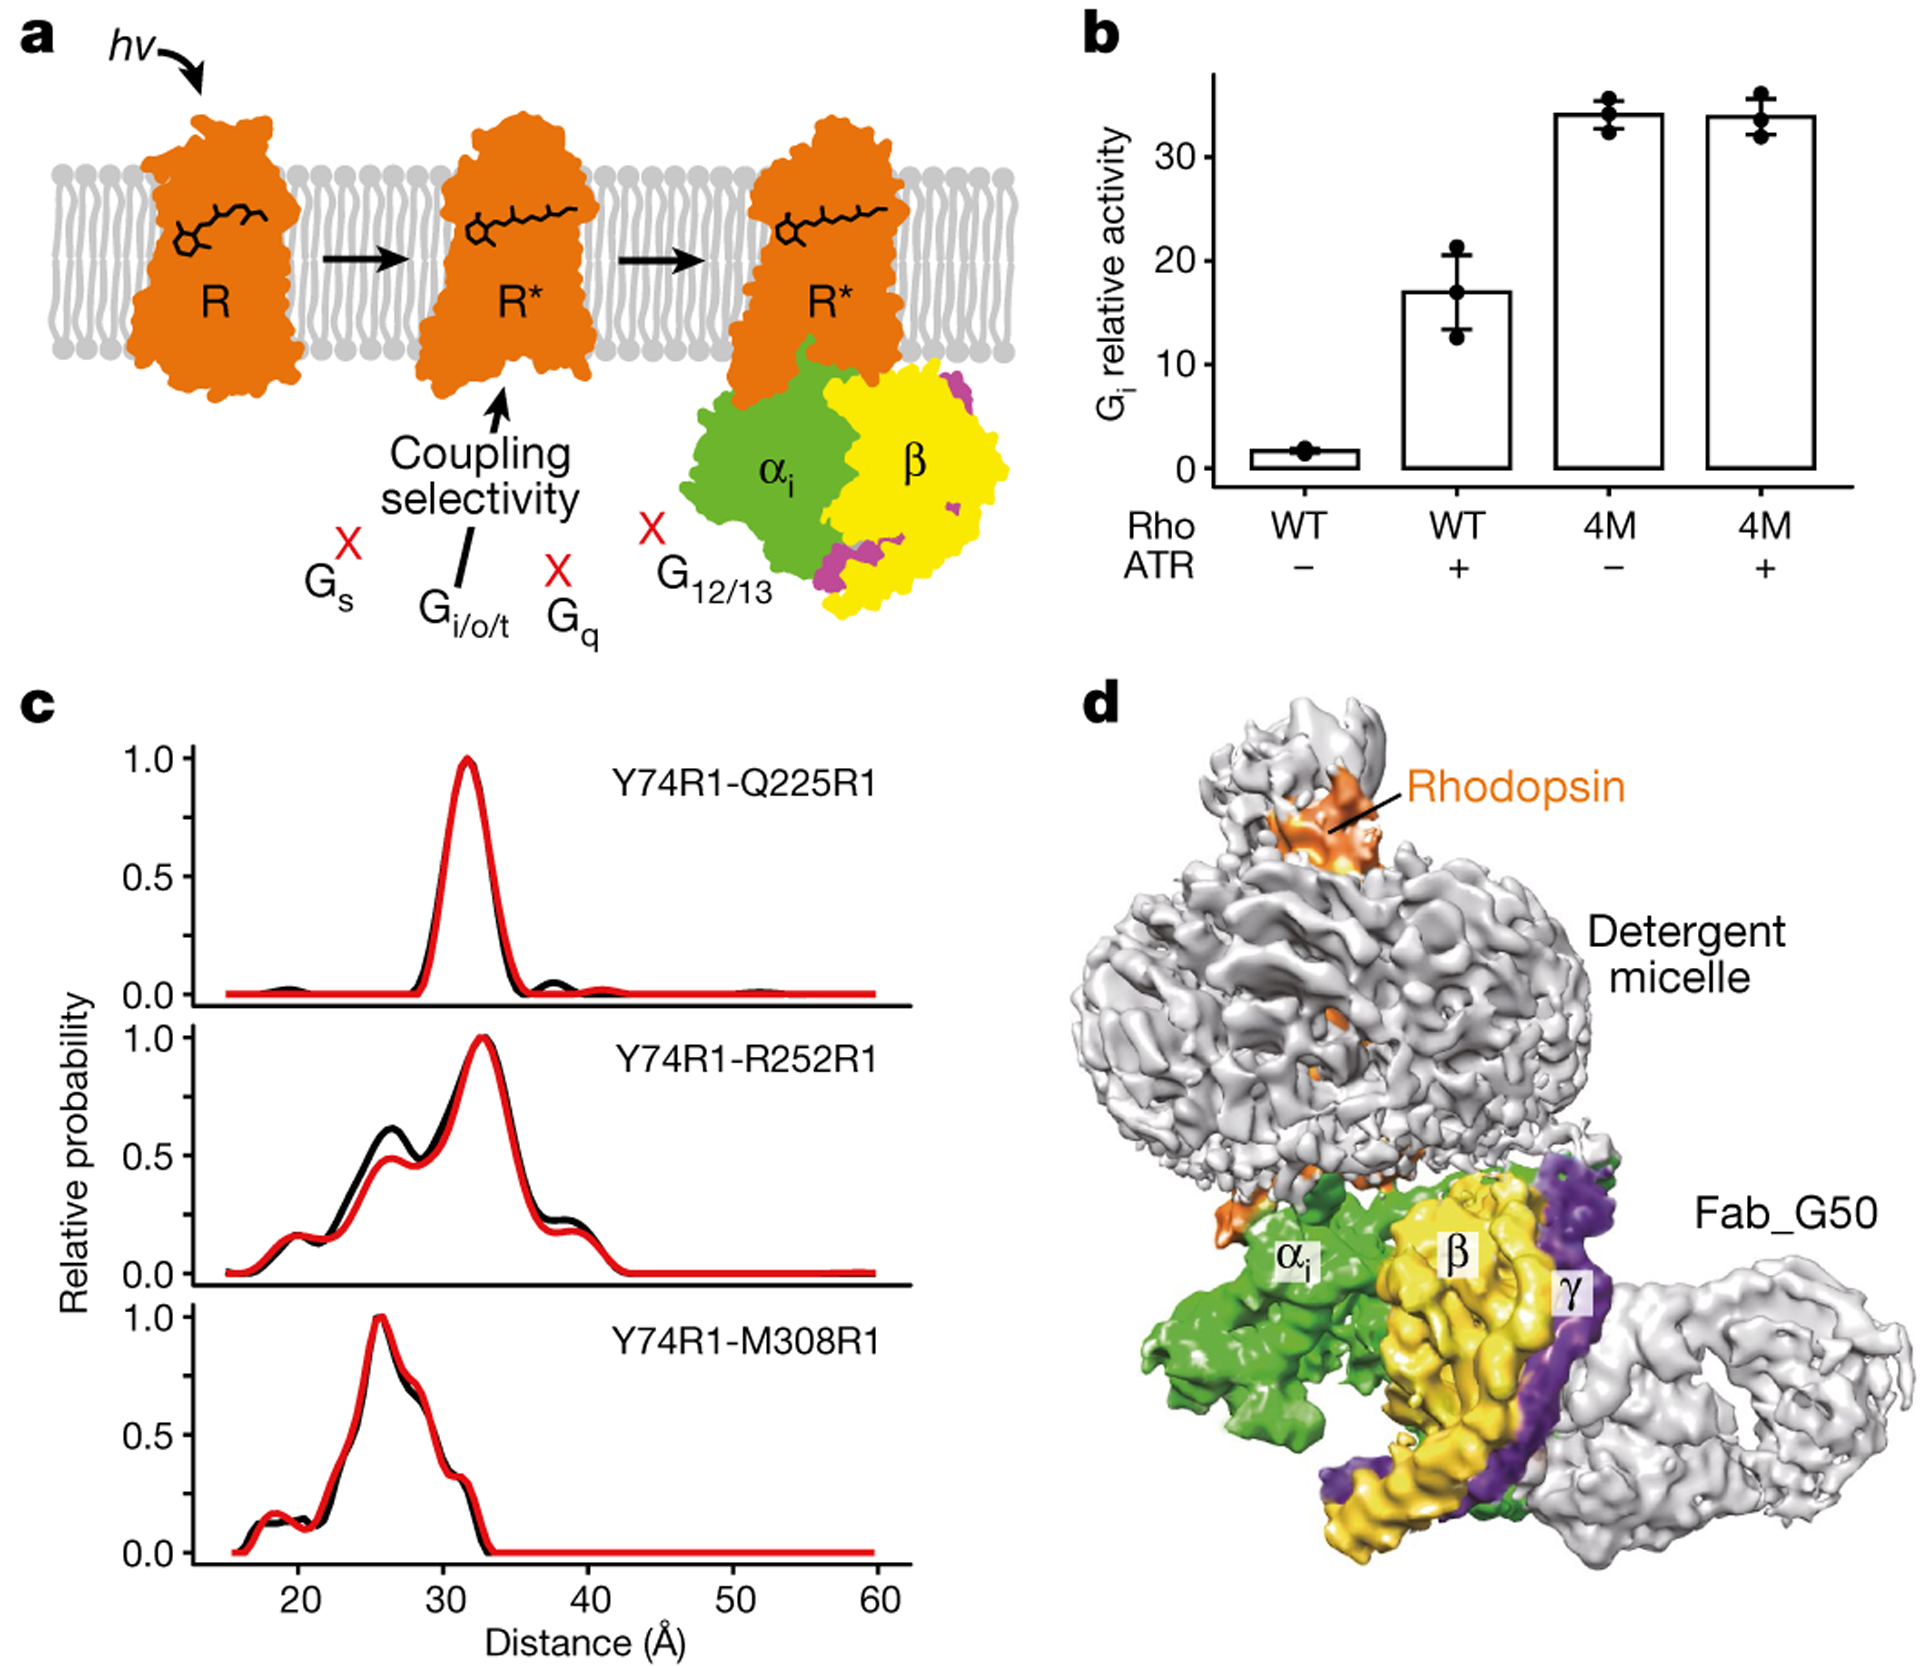
G-protein-coupled receptors comprise the largest family of mammalian transmembrane receptors. They mediate numerous cellular pathways by coupling with downstream signalling transducers, including the hetrotrimeric G proteins Gs (stimulatory) and Gi (inhibitory) and several arrestin proteins. The structural mechanisms that define how G-protein-coupled receptors selectively couple to a specific type of G protein or arrestin remain unknown. Here, using cryo-electron microscopy, we show that the major interactions between activated rhodopsin and Gi are mediated by the C-terminal helix of the Gi α-subunit, which is wedged into the cytoplasmic cavity of the transmembrane helix bundle and directly contacts the amino terminus of helix 8 of rhodopsin. Structural comparisons of inactive, Gi-bound and arrestin-bound forms of rhodopsin with inactive and Gs-bound forms of the β2-adrenergic receptor provide a foundation to understand the unique structural signatures that are associated with the recognition of Gs, Gi and arrestin by activated G-protein-coupled receptors.


Conflict of interest statement

Competing interests The authors declare no competing interests.

Figures

Extended Data Fig. 1 |
Extended Data Fig. 1 |. Purification, characterization and cryo-EM images of the Rho–Gi–Fab complex.
a, Representative elution profile of the purified Rho–Gi–Fab_G50 complex on Superdex 200 10/300 gel filtration. b, SDS–PAGE analysis of the complex after gel filtration. c, The inability of rhodopsin to stimulate the Gs-mediated signalling as assayed by the cAMP-driven luciferase reporter assays. The glucagon-like peptide 1 receptor (GLP-1R) shows stronger Gs-meditated signalling with the agonist GLP-1 (n = 3 independent experiments). Data are mean ± s.d. d, An overall view of rhodopsin showing the three intramolecular distances between two nitroxide N–O bonds based on the models of the R1 nitroxide pairs Y74R1-Q225R1, Y74R1-R252R1 and Y74R1-M308R1, respectively (Y742.41, Q2255.60, R2526.35, M3087.55; superscripts denote Ballesteros–Weinstein numbering). R1 side-chain modelling details have been described previously. e, Similar DEER distance distributions of TM6 and TM7 to TM2 of rhodopsin bound to Gi and Gt. f, Time domain data of DEER measurements.
Extended Data Fig. 2 |
Extended Data Fig. 2 |. Cryo-EM images and single-particle analysis of the Rho–Gi–Fab complex.
a, Representative cryo-EM micrograph of Rho–Gi–Fab complex. Examples of particle projections are circled. b, Reference-free two-dimensional class averages of the complex in digitonin micelles. c, Half-map Fourier shell correlation (FSC) plots as produced by RELION with the mask used shown as an inset. d, FSC curve of model versus the full map, as well as FSC curves obtained for a model refined against a half-map and compared to the two half-maps as well as the full model. The r.m.s.d. between the model refined against half-map and compared to the full map, and the one refined against the full map is 0.984 Å, and their corresponding FSCs against the final map show a resolution difference at the 0.5-cutoff of approximately 0.1 Å. e, Particle classification and refinement. f, Local resolution map of the rhodopsin–Gi complex.
Extended Data Fig. 3 |
Extended Data Fig. 3 |. Electron microscopy density map of rhodopsin–Gi complex.
ac, Three views of the electron microscopy density map of the rhodopsin–Gαi interface. d, Electron microscopy density map of all rhodopsin transmembrane helices and helix 8. eg, An overall view of the rhodoposin–Gαi interface (e), and electron microscopy density map for the TM6 of rhodopsin (f) and the α5-helix of Gαi (g).
Extended Data Fig. 4 |
Extended Data Fig. 4 |. The rhodopsin–Gi interface and disulfide crosslinking of rhodopsin with Gαi.
a, The rhodopsin–Gi interface surrounding the G352 residue of Gαi α5-helix. Not all side chains shown are visible in the map but shown here for illustrating their Cα positions to facilitate understanding of data in panel b. b, Lack of disulfide crosslinking of G352C of Gi with surrounding residues from rhodopsin (compare with d; n = 3 independent experiments). c, Interactions at the interface between ICL2 of rhodopsin and αN helix of Gαi. The side chains are not visible in the map but shown here for illustrating their Cα positions. d, Demonstration that E28C of Gαi can be disulfide cross-linked to rhodopsin residues N145CICL2 and F146C ICL2 (n = 3 independent experiments).
Extended Data Fig. 5 |
Extended Data Fig. 5 |. Structural comparison of Gi-bound rhodopsin, Gs-bound GLP-1R, and Gs-bound CTR, and the role of α4-helix of Gα in receptor selectivity.
a, b, Side and cytoplasmic views of Gi-bound rhodopsin (orange) overlaid with Gs-bound GLP-1R (PDB code 5VAI, light blue, black arrows indicate differences in helix positions). c, d, Side and cytoplasmic views of Gi-bound rhodopsin (orange) overlaid with Gs-bound CTR (PDB code 5UZ7, grey). e, f, Side-by-side comparison of the rhodopsin–Gi complex (e) with the β2AR–Gs complex (f). g. An overlay of the rhodopsin–Gi complex with the β2AR–Gs complex reveals possible collision of TM5 of β2AR with α4-helix of Gαi.
Extended Data Fig. 6 |
Extended Data Fig. 6 |. The mechanism of rhodopsin-mediated Gi activation.
a, b, Superposition of the rhodopsin–Gi complex with the inactive GDP-bound Gi (PDB code 1GG2) reveals separation of the AHD from the Ras domain of Gαi (a) and conformational changes in the α5-helix (b). c, d, Side-by-side comparison of the GDP-binding site of the Gαi Ras domain in the inactive GDP-bound Gαi (c) and nucleotide-free state Gαi with GDP added for comparison (d).
Extended Data Fig. 7 |
Extended Data Fig. 7 |. Collective variables for mABP simulations and free-energy landscapes of mABP simulations.
a, To bias movement between TM6 relative to that of the receptor bundle, two centre-of-geometry (COG) distance collective variables (CVs) were implemented into fABMACS. CV1 and CV2 are COG distances between selected atoms of TM6 to TM1/2 and TM6 to TM3/4 respectively. Collective variable atoms for the rhodopsin simulation are highlighted. b, COG collective variable formula and the CV1 and CV2 distances. c, Potential energy surface reveals that CV1 and CV2 distances are larger in the Gs-coupled receptors (A2AR and β2AR) than those in the Gi-coupled receptors (mOR1 and rhodopsin).
Extended Data Fig. 8 |
Extended Data Fig. 8 |. Enrichment profiles for Gi and Gs coupling receptors.
ac, Relative probability of hydrophobic and polar residues for Gi (n = 76) and Gs (n = 25) coupling receptors. Residues with relative enrichments over 20% were mapped onto the structures of Gs-bound β2AR (b) and Gi-bound rhodopsin (c). GPCR principal coupling was previously defined. df, Interaction network of TM6.36 of β2AR, A2AR and rhodopsin with the G protein α5-helix. g, Hydrogen bonding between TM3.36 and the backbone of TM6.
Fig. 1 |
Fig. 1 |. Assembly of the rhodopsin–Gi protein complex.
a, Schematic illustration of G-protein-mediated GPCR signalling by the four types of G protein. Light-activated rhodopsin is specifically coupled to the Gi/o/t subtype. b, Gi signalling activated by the 4M mutant and wild-type (WT) rhodopsin as measured by a serum response element (SRE)-driven luciferase reporter assay (n = 3). Data are mean ± s.d. c, Experimental DEER distance distributions of rhodopsin in the presence (red line) or absence (black line) of Fab. Y74R1-Q225R1, Y74R1-R252R1 and Y74R1-M308R1 denote R1 nitroxide pairs. d, Iso-surface rendering of the cryo-EM density map for the rhodopsin–Gi–Fab complex.
Fig. 2 |
Fig. 2 |. The cryo-EM structure of the rhodopsin–Gi complex.
a, b, Orthogonal views of the cryo-EM density map of the rhodopsin–Gi complex, coloured by subunits. c, d, Ribbon diagram representation of the structure of the rhodopsin–Gi complex.
Fig. 3 |
Fig. 3 |. The rhodopsin–Gi interface.
a, b, Two views of the binding interface between the α5-helix of the Gαi Ras-like domain and the TMD cavity of rhodopsin. c, Rendering of electrostatic surfaces involved in interaction of rhodopsin and Gαi, with blue for positively charged regions and red for negatively charged regions. d, Sequence alignment of the last 11 residues of the α5-helix from different G proteins, with key residues in receptor binding highlighted by colour shading.
Fig. 4 |
Fig. 4 |. Structural comparison of Gi-bound rhodopsin with inactive rhodopsin, arrestin-bound rhodopsin, and GαCT-bound rhodopsin.
a, Side and cytoplasmic views of the Gi-bound transmembrane bundle (orange) in superposition to the inactive rhodopsin (PDB code 1U19, cyan) and arrestin-bound rhodopsin (PDB code 4ZWJ, green). b, Superposition of Gi-bound rhodopsin (orange) with GαCT-bound rhodopsin (yellow). Differences in transmembrane domains at the cytoplasmic faces are highlighted.
Fig. 5 |
Fig. 5 |. Structural comparison of Gi-bound rhodopsin with Gs-bound β2AR.
a, b, Side view of the inactive rhodopsin structure (PDB code 1U19, cyan) superposed with inactive β2AR (PDB code 2RH1, pink). c, d, Side and cytoplasmic views of Gi-bound rhodopsin compared to Gs-bound β2AR (PDB code 3SN6, blue). Notable structural changes are seen for the intracellular domains of TM6 with a difference of approximately 8 Å at the cytoplasmic end of the helix. The α5 helix of Gαi (green) is rotated 20° away from TM6 compared to that of Gαs (purple). As indicated, there are differences in the locations of the α-helical domains (AHD) of these two G proteins. e, f, Illustration of the 20° rotation of Gαi (e) and the 16 Å shift in βγ as compared to the structure of Gs (f).
Fig. 6 |
Fig. 6 |. TM6 dynamics of Gi- and Gs-coupled receptors.
a, Gi-coupled receptors exhibit a markedly constrained range of motion compared to Gs-coupled receptors. Comparison of overlapped free energy landscapes truncated at 10 kJ mol−1 for Gi- and Gs-coupling GPCRs plotted with their collective variables used for mABP simulations. CV1 and CV2, collective variables 1 and 2, respectively. b, Weighted TM4.40 to TM6.27 Cα distance distributions for full-length (simulations 1 and 2) and ICL3-truncated receptor simulations (simulations 3–5). An asterisk on full-length indicates that ICL3 was absent in both Gs couplers. Reference distances for Gi- and Gs-bound states (shown as black vertical dashed lines) are taken from the structure reported here and the β2AR–Gs protein complex (PDB code 3SN6). For Gi-coupled receptors with and without a complete ICL3, the outward movement of TM6 is approximately 6 Å less than that of Gs couplers. c, Representative snapshots of the most probable TM6 position taken from the first simulation replicate, overlapped with the β2AR–Gs crystal structure. Steric clashed can be seen between the TM6 of both Gi couplers and Gs. d, Schematic depicting alternative TM6 conformational states as the structural determinants for selective coupling of Gi and Gs. TM6 distance ranges were calculated using the structure of inactive rhodopsin (PDB code 1F88) as a fixed reference point.

Comment in

References

    1. Fredriksson R, Lagerström MC, Lundin LG & Schiöth HB The G-protein-coupled receptors in the human genome form five main families. Phylogenetic analysis, paralogon groups, and fingerprints. Mol. Pharmacol 63, 1256–1272 (2003). - PubMed
    1. Neves SR, Ram PT & Iyengar R G protein pathways. Science 296, 1636–1639 (2002). - PubMed
    1. Gurevich EV & Gurevich VV Arrestins: ubiquitous regulators of cellular signaling pathways. Genome Biol. 7, 236 (2006). - PMC - PubMed
    1. Zhou XE, Melcher K & Xu HE Understanding the GPCR biased signaling through G protein and arrestin complex structures. Curr. Opin. Struct. Biol 45, 150–159 (2017). - PubMed
    1. Palczewski K et al. Crystal structure of rhodopsin: a G protein-coupled receptor. Science 289, 739–745 (2000). - PubMed

Publication types

MeSH terms

Substances

LinkOut - more resources