. 2018 Jun;558(7711):547-552.
doi: 10.1038/s41586-018-0219-7. Epub 2018 Jun 13.

Structure of the µ-opioid receptor-Gi protein complex

Affiliations

Structure of the µ-opioid receptor-Gi protein complex

Antoine Koehl et al. Nature. 2018 Jun.

Abstract

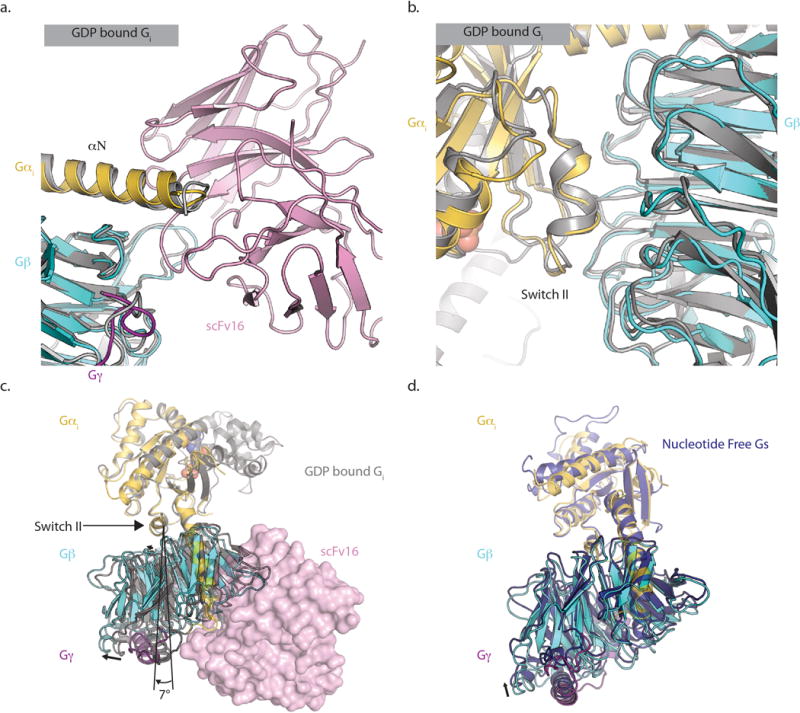
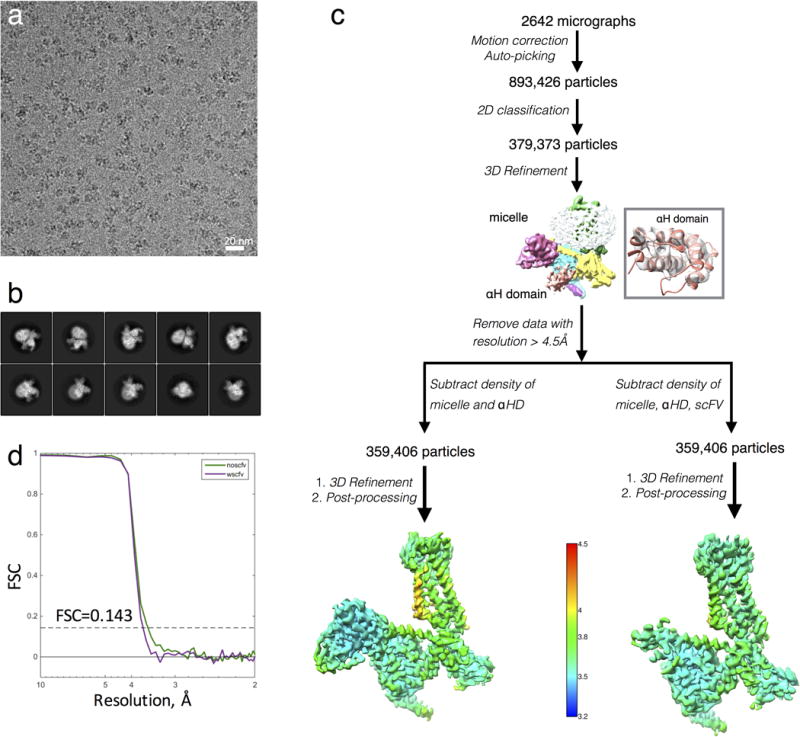
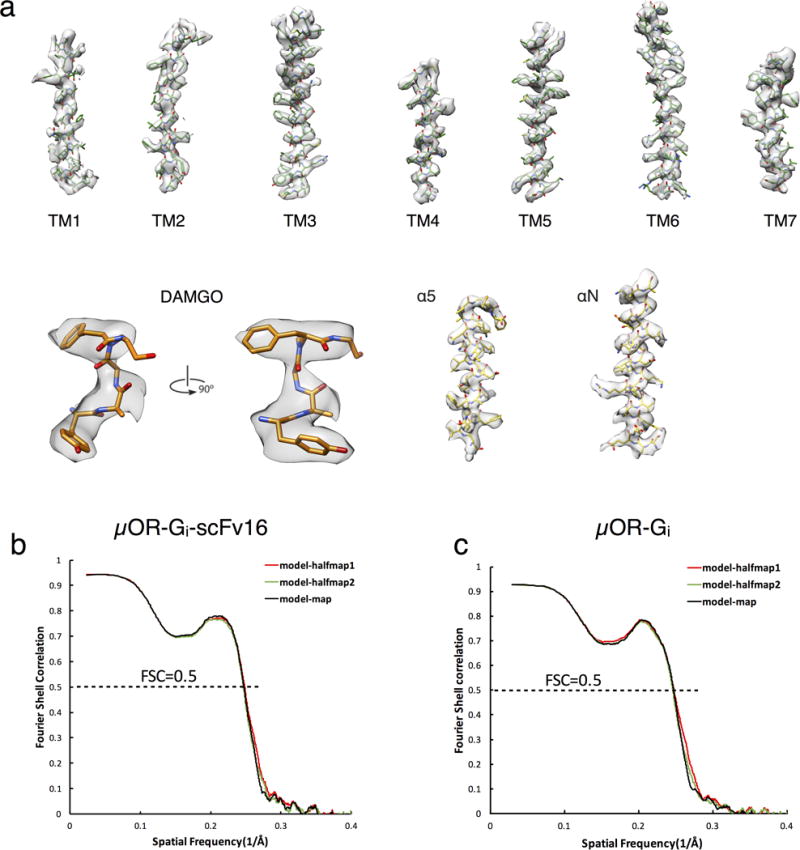
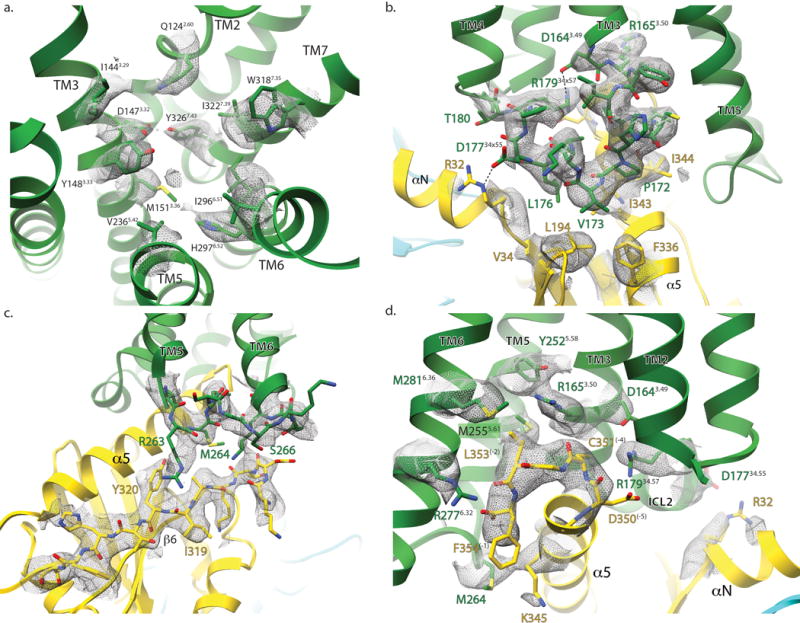
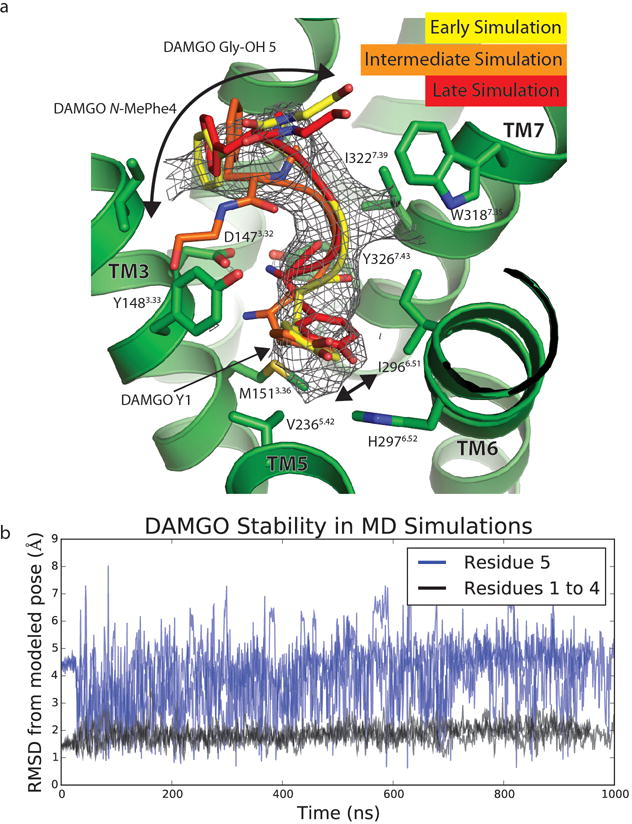
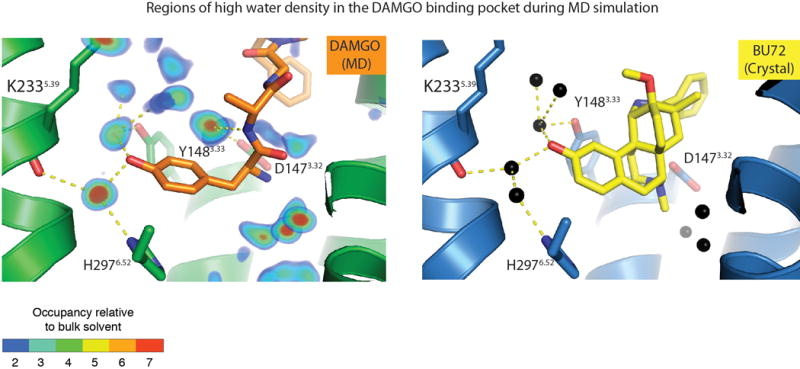
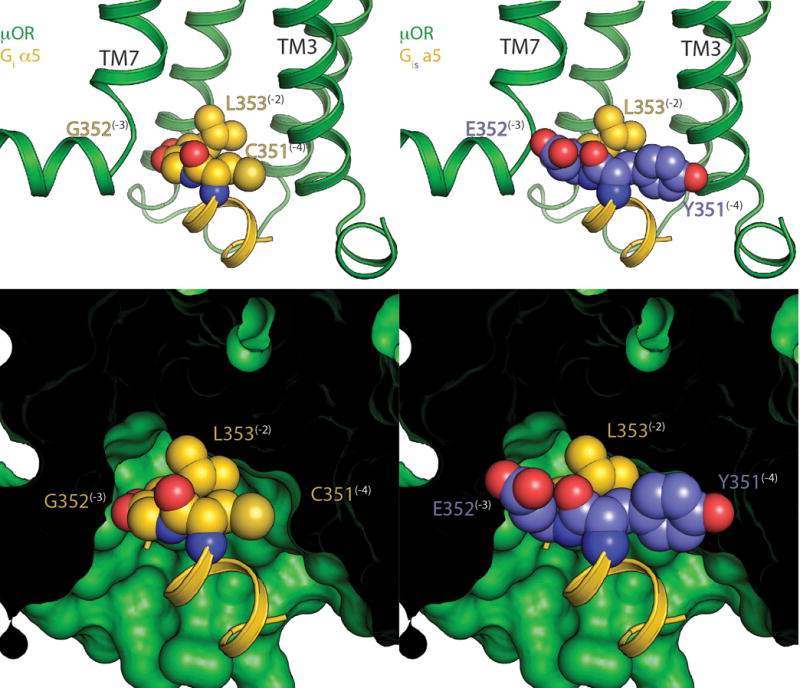
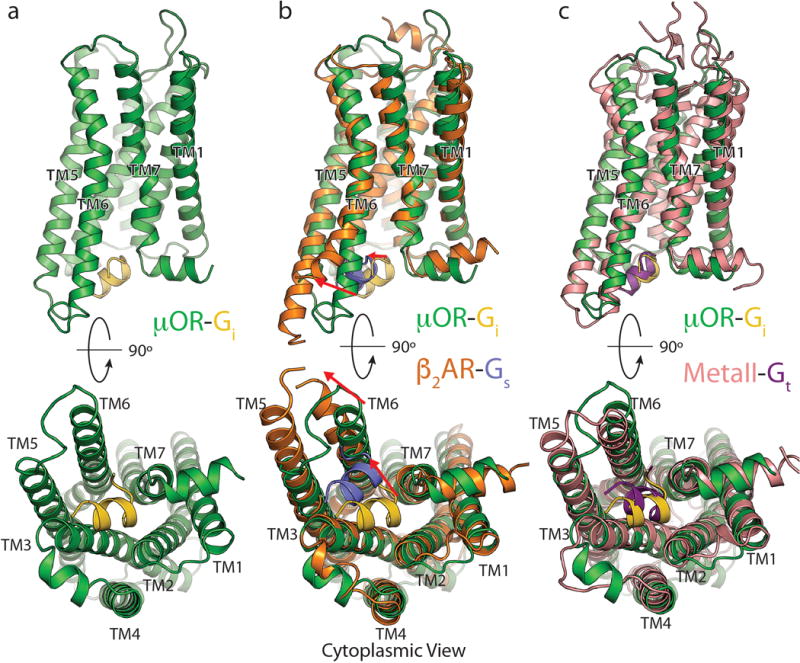
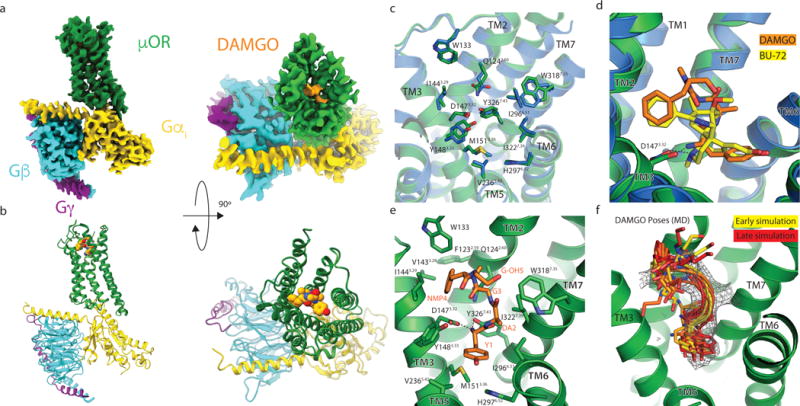
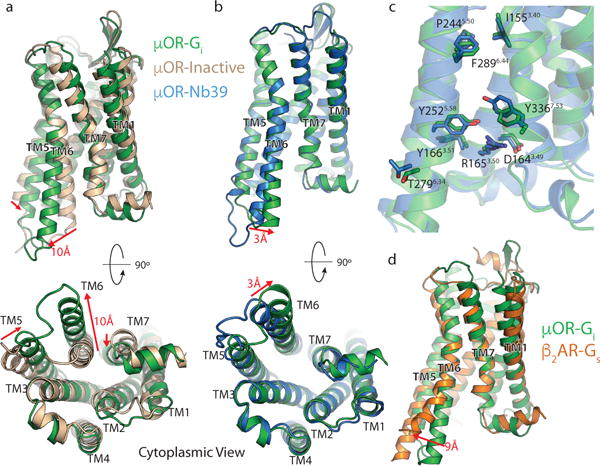
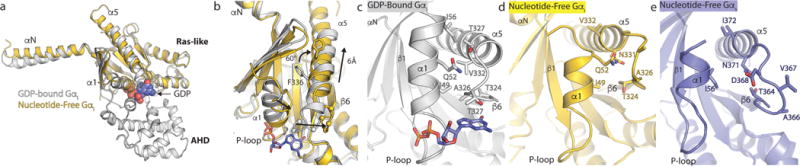
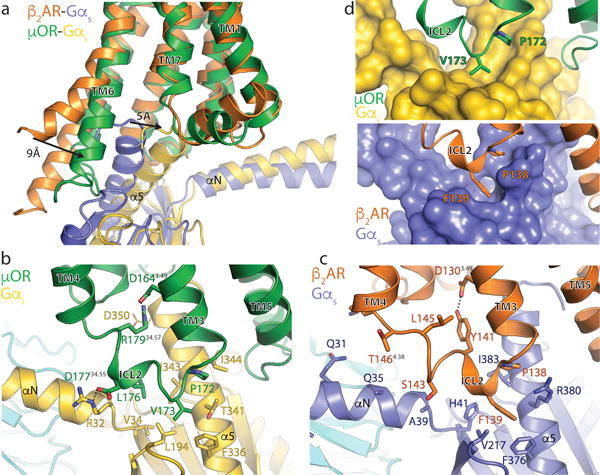
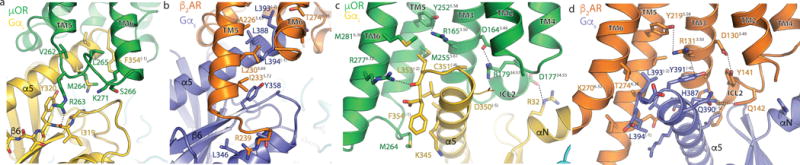
The μ-opioid receptor (μOR) is a G-protein-coupled receptor (GPCR) and the target of most clinically and recreationally used opioids. The induced positive effects of analgesia and euphoria are mediated by μOR signalling through the adenylyl cyclase-inhibiting heterotrimeric G protein Gi. Here we present the 3.5 Å resolution cryo-electron microscopy structure of the μOR bound to the agonist peptide DAMGO and nucleotide-free Gi. DAMGO occupies the morphinan ligand pocket, with its N terminus interacting with conserved receptor residues and its C terminus engaging regions important for opioid-ligand selectivity. Comparison of the μOR-Gi complex to previously determined structures of other GPCRs bound to the stimulatory G protein Gs reveals differences in the position of transmembrane receptor helix 6 and in the interactions between the G protein α-subunit and the receptor core. Together, these results shed light on the structural features that contribute to the Gi protein-coupling specificity of the µOR.


Conflict of interest statement

Author Information

The authors declare one competing interest: Brian Kobilka is a founder of and consultant for ConfometRx, Inc. Readers are welcome to comment on the online version of the paper.

Figures

Extended Data Figure 1
Extended Data Figure 1. scFv binding characteristics
scFv 16 does not perturb the interfaces between Gα and Gβ at a) its binding epitope or b) the Switch II region located ~40A away. Our structure is colored by chain, while the structure of GDP-bound Gi1 heterotrimer (PDB 1GP2) is colored grey. c) In the nucleotide-free state, there is a ~7˚ rotation of G βγ relative to the Gαs Switch II domain when compared to the GDP-bound form. This rotated conformation is similar to that observed in nucleotide-free Gs coupled to the β2AR (PDB ID 3SN6) as shown in panel d).
Extended Data Figure 2
Extended Data Figure 2. Cryo-EM data processing
a, Representative cryo-EM micrograph of the μOR-Gi complex. Scale bar, 20nm. b, Representative two-dimensional averages showing distinct secondary structure features from different views of the complex. c, Flow chart of cryo-EM data processing. The unmasked map in the middle of the chart has been colored by subunit. The inset shows the fit of the crystal structure of the α-helical domain in the corresponding density of the unmasked reconstruction. Three-dimensional density maps colored according to local resolution. d, “Gold standard” Fourier shell correlation (FSC) curves from Phenix indicates overall nominal resolutions of 3.5 Å and 3.6 Å using the FSC=0.143 criterion for the scFv-subtracted map (green curve) and scFv-retained maps (purple curve), respectively.
Extended Data Figure 3
Extended Data Figure 3. Cryo-EM map vs. refined structure
a) EM density map (scFv subtracted) and model are shown for all seven transmembrane α-helices of the μOR, DAMGO, and Gα helices α5 and αN. b,c) Cross-validation of model to EM density map. The model was refined against one half map after displacement of atoms by 0.2A, and FSC curves were calculated between this model and the final cryo-EM map (full dataset, black), of the outcome of model refinement with a half map versus the same map (red), and of the outcome of model refinement with a half map versus the other half map (green). The results of the scFv-retained model vs. map and of scFv subtracted model vs. map are shown in b) and c), respectively.
Extended Data Figure 4
Extended Data Figure 4. Selected cryo-EM densities of μOR-Gi Complex
Cryo-EM density (displayed as mesh) surrounding residues involved in a) DAMGO binding, b) μOR-Gαi interaction around ICL2, c) ICL3, and d) cytoplasmic ends of the μOR transmembrane helices. These figures accompany the models shown in figures 1e, 4b, 5a, and 5b respectively.
Extended Data Figure 5
Extended Data Figure 5. Stability of DAMGO in MD Simulations
a. Over the course of MD simulations, the positions of the first 4 residues of DAMGO do not significantly change, while the 5th residue (Gly-ol) shows significant variability in position. Frames from the first and last 100 ns are shown with an intermediate to highlight both the relative stability of the first 4 amino acids, as well as the flexibility of the fifth. Arrows show the extent of motion in the N- and C-terminal residues over the course of simulation. Cryo-EM density for DAMGO is shown as mesh. b. Root mean standard deviations (RMSDs) from the modeled pose of DAMGO to the pose during MD simulations. The RMSD calculations include heavy atoms on the peptide backbone. Data from three independent simulations are plotted. The RMSDs for residues 1 to 4 (black) and the C-terminal Gly-ol (blue) are plotted separately to highlight their stability and mobility, respectfully.
Extended Data Figure 6
Extended Data Figure 6. Water occupancy in orthosteric binding site
Left panel, water occupancy in MD simulations of DAMGO-bound μOR overlaid with a representative conformation from MD simulations. ‘Occupancy relative to bulk solvent’ is the ratio of the rate at which water is observed in a given volume to the rate at which water is expected to be observed in an equivalent volume in the bulk solvent. For example, blue regions (occupancy ratio = 2) are occupied by water twice as often as an equivalent region in the bulk solvent. Right panel, crystallographic waters in the BU72-bound μOR binding pocket (PDB ID: 5C1M). Waters are shown as black spheres, BU72 is shown as yellow sticks, and hydrogen bonds are shown as dashed lines.
Extended Data Figure 7
Extended Data Figure 7. Comparison of the C-termini of Gαs and Gαi
The C-terminus of Gαs is bulkier than that of Gαi due to substitution of small amino acids C (−4 position) and G (−3 position) in Gαi to Y and E respectively in Gαs. This leads to steric clashes with TMs 3 and 7 of the μOR. Top - ribbon view of μOR (green) with WT Gαi (gold, left) and a Gαis model (right) created by substituting C and G for Y and E based on the β2AR-Gs crystal structure. Substituted positions are colored in light purple. The −4 to −2 positions have their side chains shown as spheres, and the rest as a ribbon. Bottom - space filling view of the μOR showing the steric clashes that result from these substitutions.
Extended Data Figure 8
Extended Data Figure 8. Comparison of Gai C terminal peptide binding modes
Side (top half), and cytoplasmic (bottom half) views of a) the μOR (green) with the last 11 residues of Gαi (gold) alone, b) compared to the β2AR(orange) with the last 11 residues of Gαs (light purple) (PDB ID 3SN6), or c) compared to MetaII Rhodopsin (pink) in complex with an 11 residue Gtransducin (Gt) C-terminal peptide (dark purple) (PDB ID 3PQR). The mOR-Gi complex aligns best with the MetaII-Gt complex both in terms of TM6 displacement as well as position of the α5 peptide.
Figure 1
Figure 1. Cryo-EM structure of the μOR-Gi complex
a, Orthogonal views of the cryo-EM density map of the μOR-Gi heterotrimer complex colored by subunit (μOR in green, DAMGO in orange, G⍺s Ras-like domain in gold, Gβ in cyan, Gγ in purple). b, Model of the μOR-Gi complex in the same views and color scheme as shown in a. c, Residues that line the μOR orthosteric binding pocket are shown as sticks for the μOR-Gi complex (green) and the μOR-Nb39 complex (PDB 5C1M; blue). The binding pocket residues of DAMGO and BU-72 occupied μOR show nearly identical conformations, despite differences in ligand structure. d, Comparison of BU-72 (yellow carbons) in the orthosteric pocket of the μOR-Nb39 complex (blue) with DAMGO (orange carbons) in the orthosteric pocket of the μOR-Gi complex (green). e, view of DAMGO in the orthosteric binding pocket with critical residues shown. f, A frame from every 100 ns of a 1 μs MD simulation (yellow for t = 0 fading to red for t = 1 μs) shows that the first 4 residues of DAMGO (bottom) are stable, whereas the C-terminal Gly-ol (top) is dynamic but frequently returns to the modeled pose.
Figure 2
Figure 2. Structural changes in the μOR stabilized by nucleotide-free Gi
a, Comparison of inactive μOR (brown) and the Gi stabilized active state of μOR (green). b, Comparison of Nb39 and Gi stabilized active states of the μOR (blue and green, respectively). The structures are nearly identical except for a slight shift of TM6 towards TM7 in the Gi -bound state. c, Residues important for activation of the μOR show nearly identical conformations despite the difference in ligands. d, Comparison of Gs-stabilized β2AR (orange) and Gi-stabilized μOR (green). While most transmembrane helices align well between the two receptors, TM6 is kinked further outward by 9Å in the β2AR. Distance calculated between Cα of residue 6.29 (Ballesteros-Weinstein numbering) in TM6.
Figure 3
Figure 3. Changes in Gi upon coupling to the μOR
a, b, Comparison of GDP-bound Gαi (PDB 1GP2, grey) and nucleotide-free Gαi from the μOR-Gi complex (gold). GDP is shown as blue spheres in panel a and sticks in panel b. The primary differences between these two structures are the opening and outward movement of the alpha helical domain (AHD), and an upward shift of the α5 helix by 6Å to engage the receptor core. The α-carbons of the TCAT motif are represented as spheres in panel b. The TCAT motif coordinates the guanosine base of GDP. The upward shift of the α5 helix and repositioning of the TCAT motif leads to nucleotide release. c, d, e, The interface between the α1 helix and the N-terminal end of the α5 helix and TCAT motif for GDP-bound Gαi (c), nucleotide free Gαi (d), and nucleotide free Gs from the β2AR -Gs complex (e). The upward movement of the α5 helix disrupts the interaction between the α1 and α5 helices leading to changes in the P-loop that coordinates the phosphates of GDP.
Figure 4
Figure 4. Comparison of the receptor-G protein binding interfaces of the μOR-Gi and β2AR-Gs complexes
a, Comparison of the conformation of the α5 helix of Gα and receptor TM6 in β2AR-Gs and μOR-Gi complexes after alignment on the receptor. b, Interactions between ICL2 of the μOR (green) and Gαi (gold). Asp 350 of Gαi is depicted with narrow lines to indicate uncertainty in its conformation due to poor cryo-EM density for its side chain. c, Interactions between ICL2 of the β2AR (orange) and Gαs (blue). d, Surface view of the hydrophobic pockets in Gαi (top panel) and Gαs (bottom panel) that interact with a non-polar amino acid in ICL2 of the μOR and β2AR, respectively.
Figure 5
Figure 5. Comparison of the receptor-G protein binding interfaces of the μOR-Gi and β2AR-Gs complexes
Top panels show interactions between ICL3 of μOR and Gαi (a) and between the cytosolic ends of TMs 3,5,6, of the μOR and the α5 helix of Gi (b). Asp 350 of Gαi is depicted with narrow lines to indicate uncertainty in its position due to poor cryo-EM density for its side chain. Bottom panels show these same interfaces between β2AR and Gs (c,d).

Comment in

References

    1. Matthes HW, et al. Loss of morphine-induced analgesia, reward effect and withdrawal symptoms in mice lacking the mu-opioid-receptor gene. Nature. 1996;383:819–823. - PubMed
    1. Barnett ML, Olenski AR, Jena AB. Opioid-Prescribing Patterns of Emergency Physicians and Risk of Long-Term Use. N Engl J Med. 2017;376:663–673. - PMC - PubMed
    1. Connor M, Christie MD. Opioid receptor signalling mechanisms. Clin Exp Pharmacol Physiol. 1999;26:493–499. - PubMed
    1. Raffa RB, Martinez RP, Connelly CD. G-protein antisense oligodeoxyribonucleotides and mu-opioid supraspinal antinociception. Eur J Pharmacol. 1994;258:R5–7. - PubMed
    1. Raehal KM, Walker JKL, Bohn LM. Morphine side effects in beta-arrestin 2 knockout mice. J Pharmacol Exp Ther. 2005;314:1195–1201. - PubMed

Publication types

MeSH terms

Substances