Comparative Study
. 2018 Jun 13;9(1):2320.
doi: 10.1038/s41467-018-04411-5.

Deducing the presence of proteins and proteoforms in quantitative proteomics

Affiliations
Comparative Study

Deducing the presence of proteins and proteoforms in quantitative proteomics

Casimir Bamberger et al. Nat Commun. .

Abstract

The human genome harbors just 20,000 genes suggesting that the variety of possible protein products per gene plays a significant role in generating functional diversity. In bottom-up proteomics peptides are mapped back to proteins and proteoforms to describe a proteome; however, accurate quantitation of proteoforms is challenging due to incomplete protein sequence coverage and mapping ambiguities. Here, we demonstrate that a new software tool called ProteinClusterQuant (PCQ) can be used to deduce the presence of proteoforms that would have otherwise been missed, as exemplified in a proteomic comparison of two fly species, Drosophila melanogaster and D. virilis. PCQ was used to identify reduced levels of serine/threonine protein kinases PKN1 and PKN4 in CFBE41o- cells compared to HBE41o- cells and to elucidate that shorter proteoforms of full-length caspase-4 and ephrin B receptor are differentially expressed. Thus, PCQ extends current analyses in quantitative proteomics and facilitates finding differentially regulated proteins and proteoforms.


Conflict of interest statement

The authors declare no competing interests.

Figures
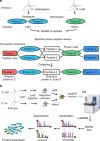
Fig. 1
Fig. 1
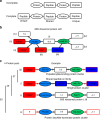
Peptide-to-protein clusters in bottom-up proteomics. a The schematic shows two orthologous proteins A or B (ellipses) present in D. melanogaster (blue) or D. virilis (green) embryos, respectively. Protein C is a paralog of protein A that is a result of a gene duplication in D. melanogaster. Proteins A and C are detected with a D. melanogaster-specific, unique peptide 1 (red rectangle) and protein B with peptides 4 and 5 (dark blue). Peptides 2 and 3 (white) are present in both orthologs A and B as well as in protein C. The peptide-to-protein cluster can be simplified in case proteins that share identical peptides are collapsed in one protein node and peptides that are shared by the same proteins are subsumed in one single peptide node. The D. melanogaster proteome is labeled light and D. virilis proteome is labeled heavy with isobaric isotopologues. b The schematic shows the workflow for a two-species comparison with isobaric isotopologue labeling. Drosophila embryos were lysed and digested with the endoprotease LysC, primary amines were dimethylated with isobaric isotopologues as light or heavy and the sample was analyzed with MudPIT on an Orbitrap series mass spectrometer. Peptides were identified with ProLuCID in a database search and isobaric isotopologues subsequently quantified with Census and peptide-to-protein networks analyzed in ProteinClusterQuant. Abbreviations: vir: virilis, mel: melanogaster, ESI: electrospray ionization, MS: mass spectrum
Fig. 2
Fig. 2
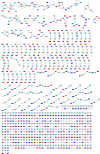
Complete peptide-to-protein network in the D. melanogaster vs. D. virilis species comparison. The network shows redundant peptides or proteins in single nodes. Peptide nodes are displayed as rectangles and protein nodes are ellipses (blue for D. melanogaster, green for D. virilis). Protein nodes comprising proteoforms of both species are shown in pink. Edges and peptide node outlines in red indicate that the relative quantification significantly deviates from the additional peptide nodes in a protein pair within a peptide-to-protein cluster. Relative abundance of peptide nodes is in the two-sample comparison is color-coded: peptide nodes in white, red, or blue are measured with a ratio, +∞ (+INF), or −∞ (−INF), respectively. The network is available online: Network 2,
Fig. 3
Fig. 3
Quantification of relative protein abundance in a peptide-to-protein cluster and classification of complete protein pairs based on ratio measurements. a Schematic of an incomplete and a complete protein pair. Peptide nodes are displayed as rectangles and protein nodes are ellipses. b The peptide-to-protein cluster of the D. melanogaster (P50887, blue ellipse) and D. virilis (B4MER5, green ellipse) orthologs of 60S ribosomal protein L22 (RpL22) is depicted. The relative peptide abundance (Rc) is indicated in each peptide node: (i) denotes peptides that are shared by two different protein nodes; (ii) and (iii) highlight peptides that are present exclusively in one sample (unique peptide nodes). The expected ratio value is n:0 or log2(n/0) = + ∞ for a D. melanogaster-specific peptide (light isotope label, red rectangles) or 0:n or log2(0/n) = −∞ for a D. virilis-specific peptide (heavy isotope labels, green rectangles). The two-species-specific peptides (iii) are connected by an additional edge in green to indicate ≥80% sequence similarity (Supplementary Methods and Note 7). Species-specific peptides that were measured with a ratio value, although an infinity value is expected, are indicted with (iv). c Four different groups of protein pairs are shown. Each group subsumes protein pairs with similar ratio values for the unique as well as shared peptide nodes. Edges and nodes rendered in red indicate that this peptide node is significantly regulated within the protein pair (protein pair-centric analysis, see below). The number of protein pairs identified for each classification is indicated on the left as well as a brief description for each group is given in italic. One example for each group is shown
Fig. 4
Fig. 4
The number of quantified peptides decreases with increased ion count threshold per peptide node. The graph shows the percentage of peptides retained in dependence of a minimum number of ion counts per peptide node. The relative number of species-specific peptides that are quantified as expected, possible, or incorrect, dropped with increasing threshold for the number of ions identified. Note that the relative number of peptides with incorrect quantifications (e.g., D. virilis, +∞ and D. melanogaster, −∞) dropped more sharply than peptides measured with expected ratios. The black arrow points to a peptide which is not in the database version used (UniprotKB/TrEMBL release 2014_05)
Fig. 5
Fig. 5
Fourteen incomplete protein pairs were converted in complete protein pairs upon considering identified but non-quantified peptide nodes. Protein pairs of the D. melanogaster (blue ellipses) and D. virilis (green ellipses) protein nodes are shown. The relative peptide abundance (Rc) is indicated in each peptide node. A value indicates a relative log2(Rc) abundance in both species, +Infinity (red rectangles) its presence in only D. melanogaster, –Infinity (green rectangles) its presence in only D. virilis, and “N/A” that the peptide node was solely identified but not quantified in its relative abundance
Fig. 6
Fig. 6
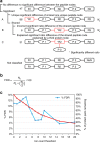
Classification of protein pairs based on user-defined settings and FDR calculation. a Protein pairs can be differentiated depending on whether unique or shared peptide nodes are significantly regulated, for example, are differentially expressed by more than a user-defined threshold. Significantly altered peptide ratios are outlined in red and connected to the corresponding protein node by an edge in red. Shared peptide nodes are not expected to be significantly regulated (incorrect) unless the shared peptide node connects to more than two protein nodes (explained). Protein pairs were not further considered in case a peptide node was missing or not determined (not classified). b An FDR is calculated according to the equation depicted. The number of protein pairs that include a shared peptide group that is significantly regulated (Ns) is used to estimate the number of falsely discovered protein pairs that include at least one significantly regulated unique peptide group (Nu). c The plot shows the relationship between number of protein pairs detected and corresponding FDR to ion count threshold settings. Abbreviations: P: protein, R: ratio
Fig. 7
Fig. 7
Select peptide-to-protein clusters with proteins differentially regulated in CFBE41o vs. HBE41o cells. a The protein cluster shows the family of related peroxiredoxin (PRDX) proteins. Edges and peptide node outlines in red as well as number associated with the edge in the peptide-to-protein clusters indicate differential expression according to the protein pair-centric analysis. b The protein cluster of serine–threonine kinase-related protein kinases PKN1, PKN2, and PKN3 is displayed. c The peptide-to-protein cluster of Na/K-ATPase proteins is depicted. It is expressed at the same levels in HBE41o and CFBE41o cells. d Western blot analysis was used to verify the difference in PKN2 expression levels between HBE41o and CFBE41o cells. Na+/K+-ATPase expression levels are shown as a loading control. Data in the western blot represent independent biological replicates, CFBE41o: n = 2, HBE41o: n = 2

Similar articles

Cited by

References

    1. Eng JK, McCormack AL, Yates JR. An approach to correlate tandem mass spectral data of peptides with amino acid sequences in a protein database. J. Am. Soc. Mass Spectrom. 1994;5:976–989. doi: 10.1016/1044-0305(94)80016-2. - DOI - PubMed
    1. Zhang Y, Fonslow BR, Shan B, Baek MC, Yates JR., III Protein analysis by shotgun/bottom-up proteomics. Chem. Rev. 2013;113:2343–2394. doi: 10.1021/cr3003533. - DOI - PMC - PubMed
    1. Tabb DL, McDonald WH, Yates JR., III DTASelect and Contrast: tools for assembling and comparing protein identifications from shotgun proteomics. J. Proteome Res. 2002;1:21–26. doi: 10.1021/pr015504q. - DOI - PMC - PubMed
    1. Zhang Y, et al. ProteinInferencer: confident protein identification and multiple experiment comparison for large scale proteomics projects. J. Proteom. 2015;129:25–32. doi: 10.1016/j.jprot.2015.07.006. - DOI - PMC - PubMed
    1. Prieto G, et al. PAnalyzer: a software tool for protein inference in shotgun proteomics. BMC Bioinform. 2012;13:288. doi: 10.1186/1471-2105-13-288. - DOI - PMC - PubMed

Publication types

MeSH terms

LinkOut - more resources