. 2018 Jun 13;9(1):2334.
doi: 10.1038/s41467-018-04781-w.

Soft transparent graphene contact lens electrodes for conformal full-cornea recording of electroretinogram

Affiliations

Soft transparent graphene contact lens electrodes for conformal full-cornea recording of electroretinogram

Rongkang Yin et al. Nat Commun. .

Abstract

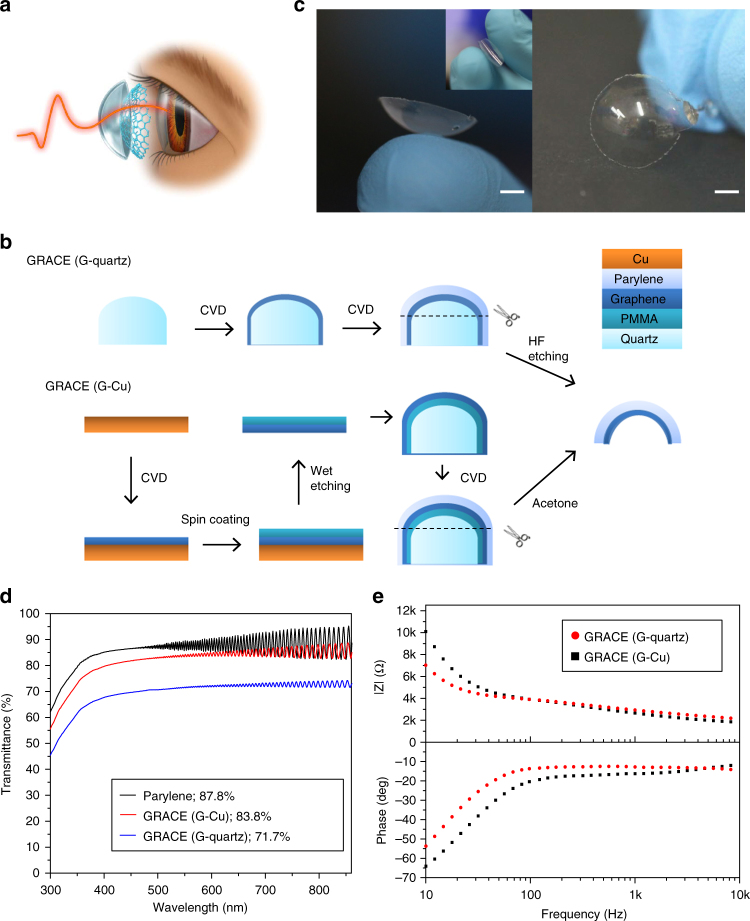
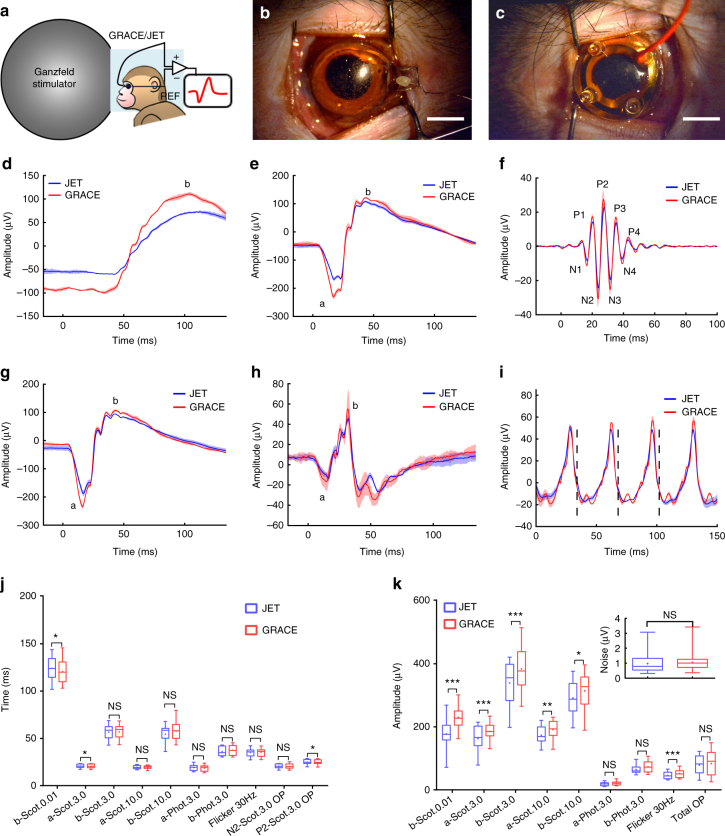
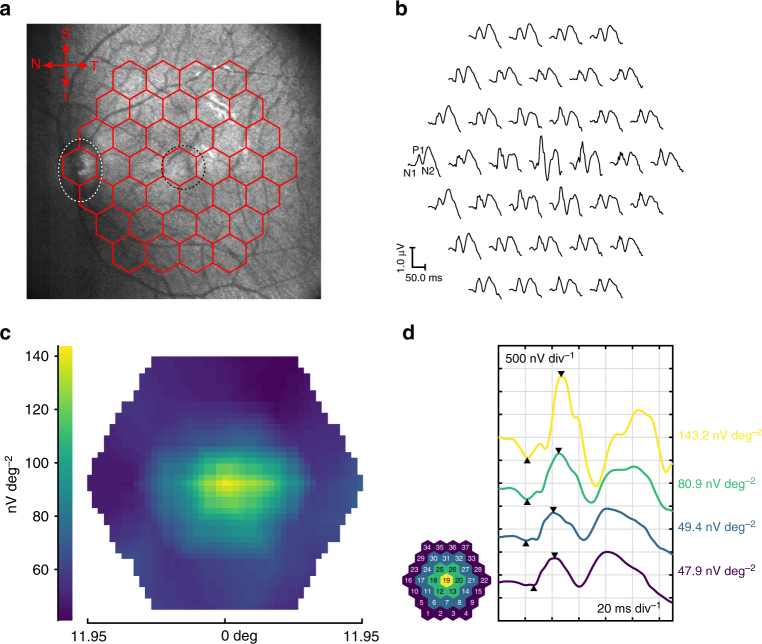
Visual electrophysiology measurements are important for ophthalmic diagnostic testing. Electrodes with combined optical transparency and softness are highly desirable, and sometimes indispensable for many ocular electrophysiology measurements. Here we report the fabrication of soft graphene contact lens electrodes (GRACEs) with broad-spectrum optical transparency, and their application in conformal, full-cornea recording of electroretinography (ERG) from cynomolgus monkeys. The GRACEs give higher signal amplitude than conventional ERG electrodes in recordings of various full-field ERG responses. High-quality topographic mapping of multifocal ERG under simultaneous fundus monitoring is realized. A conformal and tight interface between the GRACEs and cornea is revealed. Neither corneal irritation nor abnormal behavior of the animals is observed after ERG measurements with GRACEs. Furthermore, spatially resolved ERG recordings on rabbits with graphene multi-electrode array reveal a stronger signal at the central cornea than the periphery. These results demonstrate the unique capabilities of the graphene-based electrodes for in vivo visual electrophysiology studies.


Conflict of interest statement

The authors declare no competing interests.

Figures

Fig. 1
Fig. 1
GRACE device fabrication and characterization. a Schematic drawing of ERG recording with the GRACE device. b Schematic illustration of GRACE fabrication with G-quartz and G-Cu. c Photographs of a GRACE device made from G-quartz. Scale bar, 3 mm. Image in the inset demonstrates the high softness of the GRACE device. d Optical transmittance of the bare Parylene-C, and GRACE devices made from G-quartz and G-Cu, all with Parylene thickness of 25 μm. The transmittance at 550 nm wavelength is shown in the inset. e Magnitude and phase of electrochemical impedance of GRACE devices measured in 1× PBS (pH 7.4)
Fig. 2
Fig. 2
Full-field ERG recording. a Schematic of ffERG recording with ganzfeld stimulation on cynomolgus monkeys. b, c Photograph of a GRACE device and Jet electrode applied to an eye of a cynomolgus monkey, respectively. Scale bar, 5 mm. di Representative ffERG signals recorded with a GRACE device (red) and a Jet electrode (blue) from the same eye of a cynomolgus monkey, following the guidelines set by the ISCEV. The solid lines show the average signal and the shaded regions show standard deviation. n = 3 from same eye. d, e Scotopic (dark-adapted) ERG responses under 0.01 and 3.0 cd s m−2. f Scotopic oscillatory potentials (OPs) recorded under 3.0 cd s m−2. g Scotopic ERG responses under 10.0 cd s m−2. h Photopic (light-adapted) ERG responses under 3.0 cd s m−2. i Photopic 30 Hz flicker ERG responses under 3.0 cd s m−2. Different categories are presented here according to the order of recording. ‘a’ and ‘b’ mark the cornea-negative a-wave and the cornea-positive b-wave, and N1, N2, N3, P1, P2, P3…label the wavelets in oscillatory potentials. The dashed lines in i mark the midpoints of the stimulus flashes. Note that the a-wave for scotopic ERG under 0.01 cd s m−2 is absent because of the weak stimulus. j, k Summary of the implicit times and amplitudes of various ERG responses recorded by the GRACE and Jet electrodes on cynomolgus monkeys. Scot. and Phot. are the abbreviations for scotopic and photopic, respectively. The number marks the stimulus intensity. The measurements of implicit times and amplitudes for characteristic waves in various ERG responses can be found in Methods section and Supplementary Figure 2. Inset of k, RMS noise level comparison between GRACE and Jet electrode recordings. The bottom and top of the box are the first and third quartiles, the band and dot inside the box is the second quartile (the median) and mean value, respectively, the ends of the whiskers represent the minimum and maximum of all of the data. ***p ≤ 0.001, **p ≤ 0.01, *p ≤ 0.05, NS, p > 0.05; n = 30 from 10 eyes, Bonferroni correction for p-value, Wilcoxon signed-rank test analysis
Fig. 3
Fig. 3
Multifocal ERG recording. a Infrared fundus photo of a cynomolgus monkey eye taken during mfERG recording with a GRACE device, superimposed with the stimulus array. The white dotted oval marks the position of the optic nerve head and black dotted circle marks the position of the macula. b Representation of trace array recorded from the cynomolgus monkey eye in a with GRACE. The waves of 37 focal ERG signals are topographically arranged. The principal mfERG components N1, P1, and N2 can be clearly defined in these waveforms, as labeled for one of the responses. c Response density plot (retinal view) on P1-wave associated with b. d The mfERG responses grouped and averaged for each of the regions marked by different colors. The values show response density of the P1 peak (as defined by the triangles on the traces) in each of the associated regions
Fig. 4
Fig. 4
Electrode-cornea interface characterization. af Photograph and anterior segment OCT images of a bare rabbit eye (a, b), a rabbit eye wearing a GRACE (c, d), and a rabbit eye wearing a Jet electrode (e, f). The anterior segment OCT cross-sectional images in b, d, f are on corneal meridian along the directions marked by the green arrows in the lower left corners. Scale bars, 300 μm. gi Slit lamp micrographs of a bare rabbit eye (g), a rabbit eye wearing a GRACE (h), and a rabbit eye wearing a Jet electrode (i), with tear film stained with sodium fluorescein. The intensity of fluorescence represents the thickness of the tear film. Scale bar in a, c, e, gi, 5 mm
Fig. 5
Fig. 5
Multi-electrode ERG recording with soft, transparent graphene electrode array. a Diagram of graphene multi-electrode array construction showing the layered structures. b Top, a soft, transparent graphene electrode array positioned over a printed paper to show its optical transparency. Scale bar, 5 mm. The recording sites, arranged in a linear pattern, are located in the region marked by the red box. Under each recording site, there is a channel number patterned with Au which is optically opaque. Bottom, optical microscopy image showing some of the graphene electrode sites and traces. The red box marks the graphene recording sites. The black arrow points to the patterned SU-8 insulation layer on one electrode. Scale bar, 150 μm. c A stripped graphene electrode array positioned over a dilated rabbit eye. Scale bar, 5 mm. d A schematic drawing showing the positions of the recording channels (marked by the squares) on a rabbit eye. Channel 1 to 13 was evenly distributed over equator of the cornea from temporal to nasal periphery. e A representative set of the multi-electrode scotopic ERG response waveforms. Stimulus strength, 0.3 cd s m−2. The placement of the graphene electrode array is shown in d. The crosses mark the positions of the a and b- waves. Channels 4 and 7 have abnormally high impedance and are considered non-functional. f Plots of the electrode impedance values |Z| at 100 Hz, a- and b-wave amplitudes of the ERG signals recorded from different channels associated with e. The lines show the quadratic curve fitting of the a- and b-wave amplitudes. g Spatial profile of b-wave amplitudes under different stimulation strength. 0 dB corresponds to 3.0 cd s m−2. The dots in the overlaid grid mark the positions with actual experimental data

References

    1. Heckenlively, J. R. & Arden, G. B. Principles and practice of clinical electrophysiology of vision. (MIT press, Cambridge, MA, 2006).
    1. Carpi F, Tomei F. Non-invasive electroretinography. Biomed. Pharmacother. 2006;60:375–379. doi: 10.1016/j.biopha.2006.07.002. - DOI - PubMed
    1. Gjötterberg M. Electrodes for electroretinography: a comparison of four different types. Arch. Ophthalmol. 1986;104:569–570. doi: 10.1001/archopht.1986.01050160125027. - DOI - PubMed
    1. Esakowitz L, Kriss A, Shawkat F. A comparison of flash electroretinograms recorded from Burian Allen, JET, C-glide, gold foil, DTL and skin electrodes. Eye. 1993;7:169–171. doi: 10.1038/eye.1993.36. - DOI - PubMed
    1. Bach M, et al. ISCEV standard for clinical pattern electroretinography (PERG): 2012 update. Doc. Ophthalmol. 2013;126:1–7. doi: 10.1007/s10633-012-9353-y. - DOI - PubMed

Publication types

LinkOut - more resources