. 2018 May 25;9(40):25903-25921.
doi: 10.18632/oncotarget.25403.

CHL1 gene acts as a tumor suppressor in human neuroblastoma

Affiliations

CHL1 gene acts as a tumor suppressor in human neuroblastoma

Marzia Ognibene et al. Oncotarget. .

Abstract

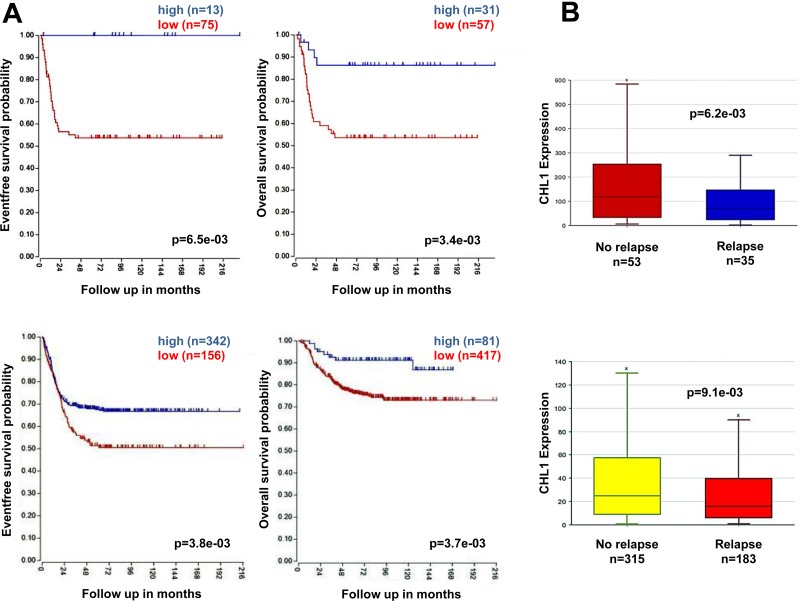
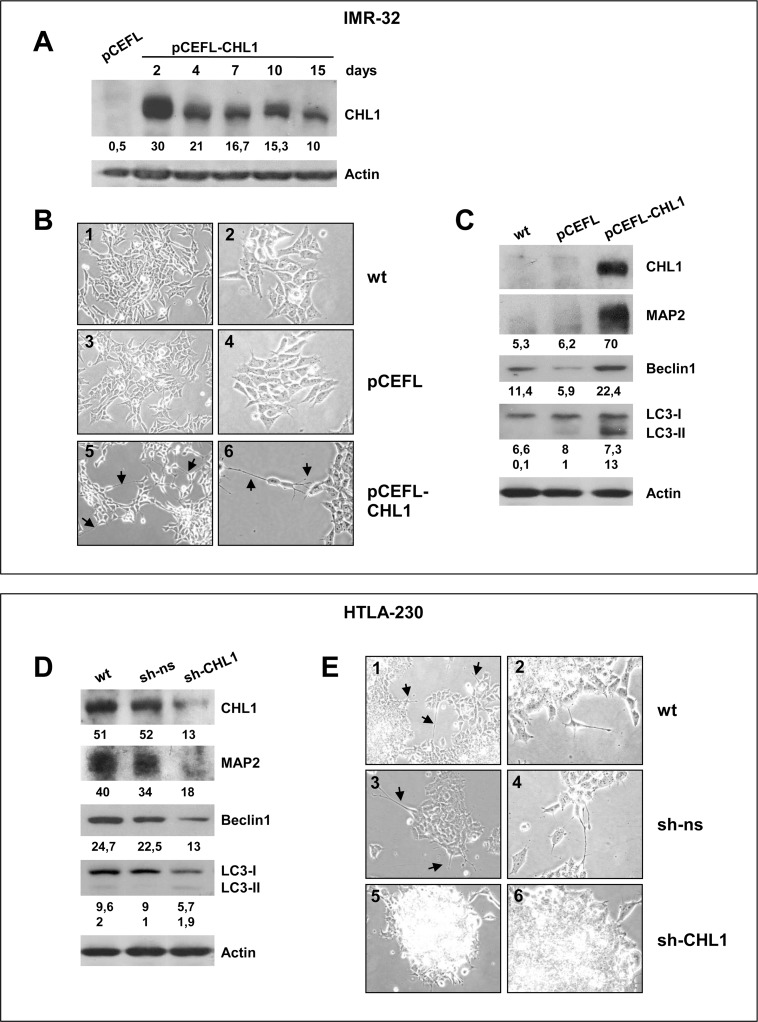
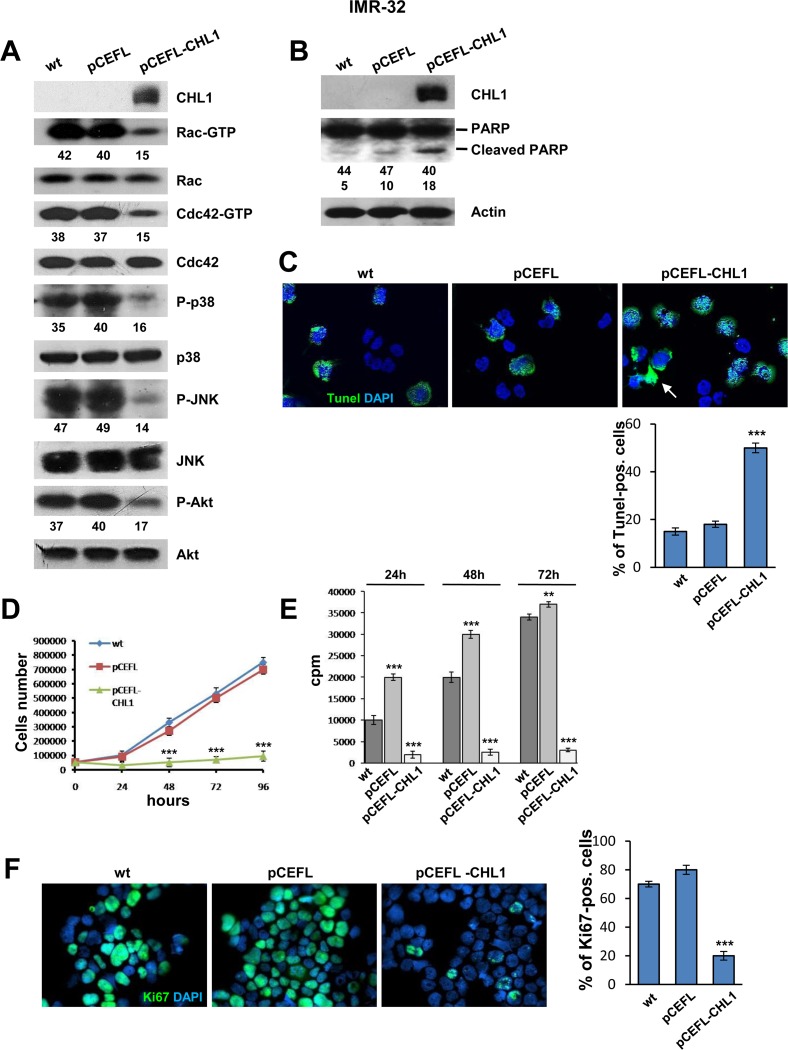
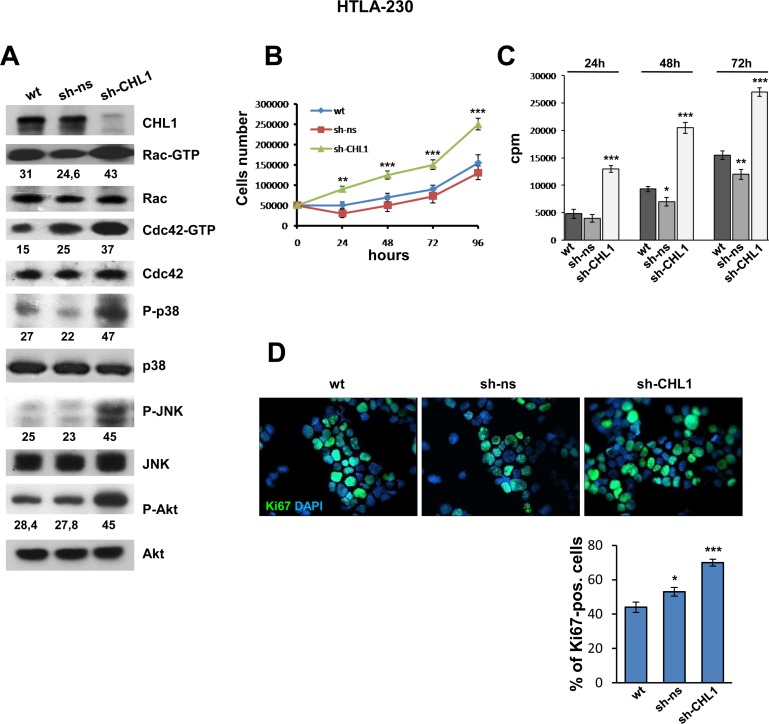
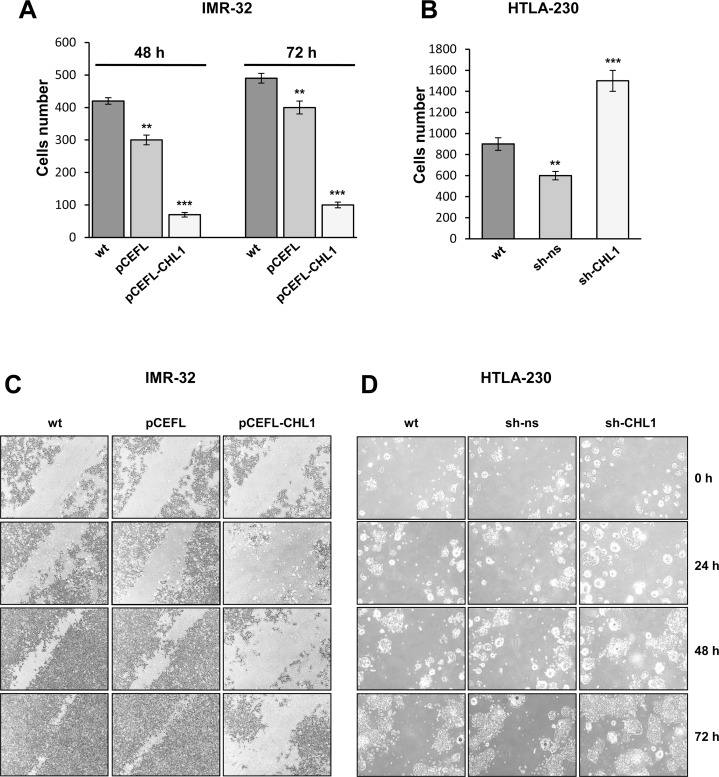
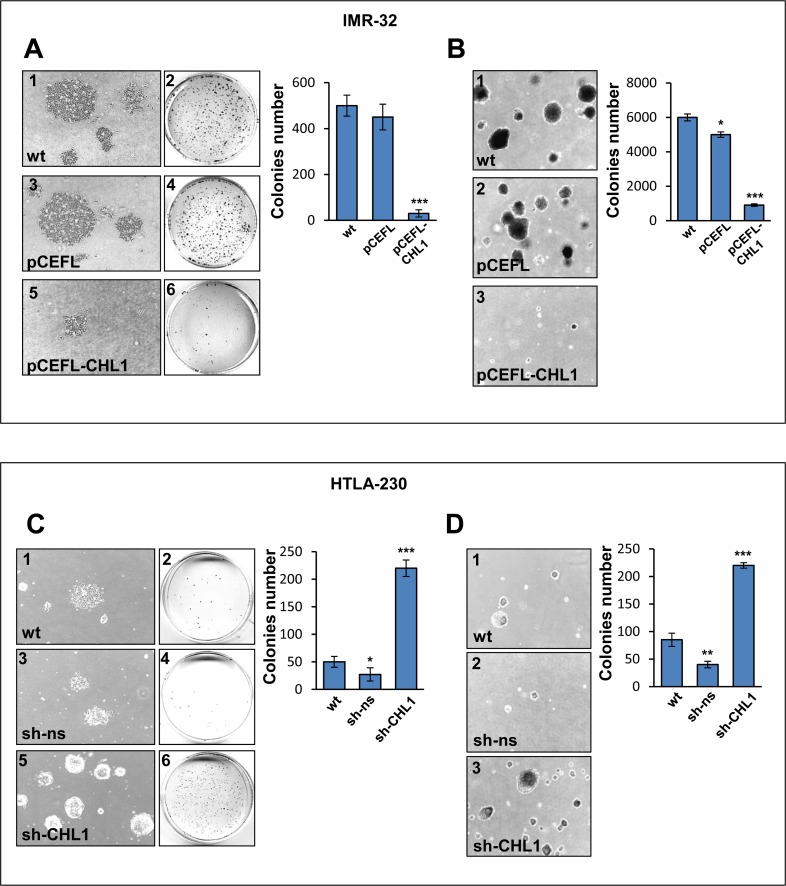
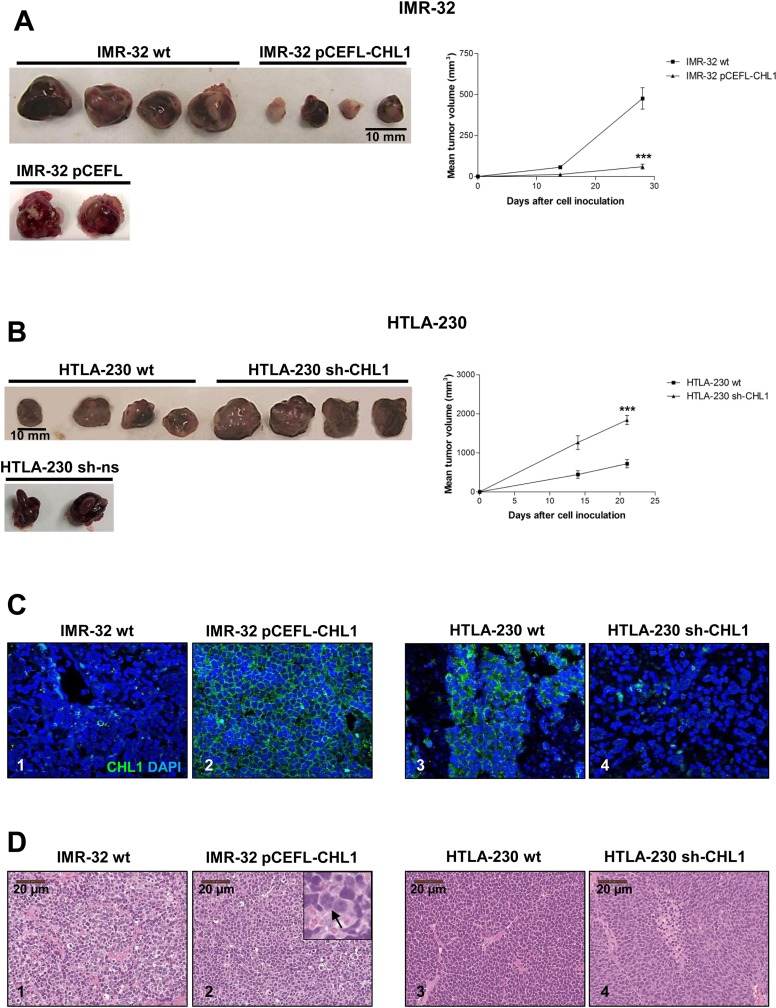
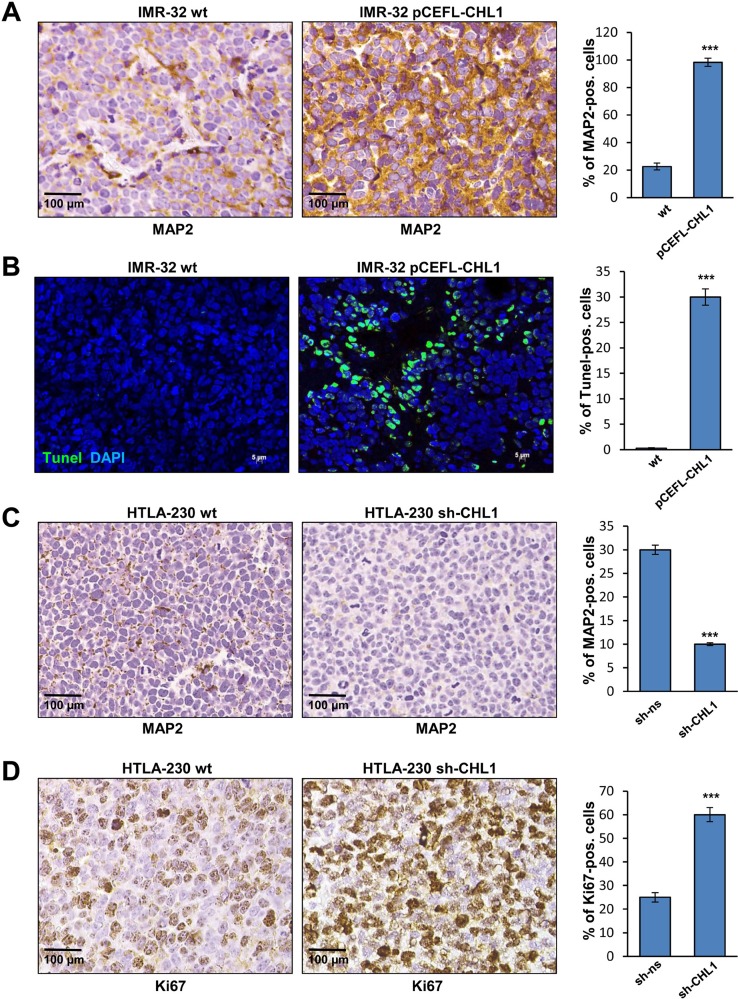
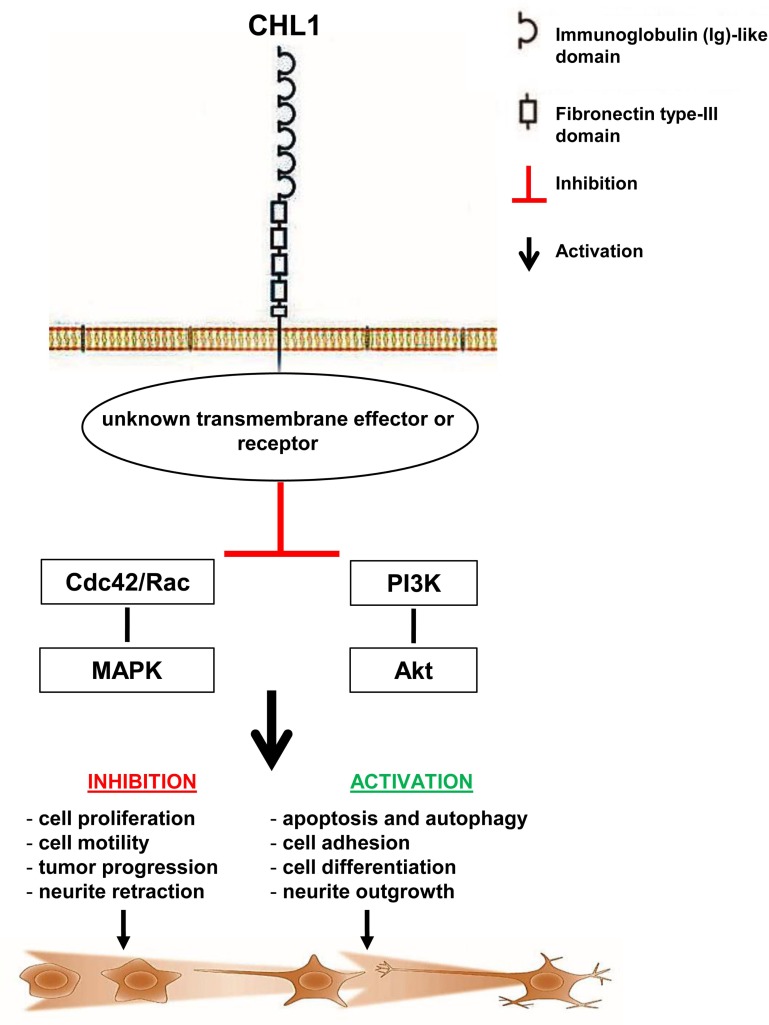
Neuroblastoma is an aggressive, relapse-prone childhood tumor of the sympathetic nervous system that accounts for 15% of pediatric cancer deaths. A distal portion of human chromosome 3p is often deleted in neuroblastoma, this region may contain one or more putative tumor suppressor genes. A 2.54 Mb region at 3p26.3 encompassing the smallest region of deletion pinpointed CHL1 gene, the locus for neuronal cell adhesion molecule close homolog of L1. We found that low CHL1 expression predicted poor outcome in neuroblastoma patients. Here we have used two inducible cell models to analyze the impact of CHL1 on neuroblastoma biology. Over-expression of CHL1 induced neurite-like outgrowth and markers of neuronal differentiation in neuroblastoma cells, halted tumor progression, inhibited anchorage-independent colony formation, and suppressed the growth of human tumor xenografts. Conversely, knock-down of CHL1 induced neurite retraction and activation of Rho GTPases, enhanced cell proliferation and migration, triggered colony formation and anchorage-independent growth, accelerated growth in orthotopic xenografts mouse model. Our findings demonstrate unambiguously that CHL1 acts as a regulator of proliferation and differentiation of neuroblastoma cells through inhibition of the MAPKs and Akt pathways. CHL1 is a novel candidate tumor suppressor in neuroblastoma, and its associated pathways may represent a promising target for future therapeutic interventions.

Keywords: CHL1 gene; apoptosis; autophagy; differentiation; neuroblastoma.


Conflict of interest statement

CONFLICTS OF INTEREST The authors declare no conflicts of interest.

Figures

Figure 1
Figure 1. Low CHL1 expression correlates with poor prognosis in NB patients
(A) Using the neuroblastoma Versteeg (top) and SEQC (bottom) patients data-sets in the R2 Genomics Analysis and Visualization Platform (http://r2.amc.nl), patients were divided into high (blue) and low (red) CHL1 gene expression groups by median-centered Log2 ratios, and survival curves were generated. Event-free survival (bottom left) and overall survival (right) curves are shown together with patients numbers in parentheses. (B) Relative CHL1 expression levels were plotted in patients with and without relapse from the Versteeg (top) and SEQC (bottom) patients data-sets. n = patients number.
Figure 2
Figure 2. CHL1 expression in 11 NB cell lines
(A) CHL1 mRNA level, quantified by q-RT-PCR, was very low in GI-ME-N, SH-EP-21N_mycn_on, LA-N-1, GI-LI-N, IMR-32, SH-EP-21N_mycn_off, SH-EP-2, SK-N-BE2(C); mean-high in HTLA-230, SK-N-SH and SK-N-F1. (B) CHL1 protein levels analyzed by Western Blot in the same NB cell lines. Lower numbers indicate densitometric values.
Figure 3
Figure 3. CHL1 and neuronal differentiation of NB cells
(A) IMR-32 cells transiently transfected with pCEFL-CHL1 and lysed 2, 4, 7, 10 and 15 days after transfection were subjected to Western blot analysis and probed with anti-CHL1 antibody. The empty vector (pCEFL) was used as negative control. (B) Morphological characteristics of IMR-32 cells wild type (wt) (1, 2); or transfected with pCEFL (3, 4); or with pCEFL-CHL1 (5, 6). Arrows indicate the neurite-like extensions. (Magnification 20× left panels, 40× right panels). (C) Protein lysates from IMR-32 cells wt, or transfected with pCEFL, or with pCEFL-CHL1 were probed with anti-MAP2, anti-Beclin1, or anti-LC3 antibodies. (D) Protein lysates from HTLA-230 cells wt, or transfected with sh-ns or with sh-CHL1 were probed with anti-CHL1, anti-MAP2, anti-Beclin 1 and anti-LC3 antibodies. Lower numbers indicate densitometric values. (E) Morphological characteristics of HTLA-230 cells wt (1, 2), or stably transfected with non-silencing control shRNA (sh-ns) (3, 4) or with silencing CHL1 shRNA plasmid (sh-CHL1) (5, 6). Cells transfected with sh-CHL1 tend to grow in clusters and may form clumps of rounded cells on top of one another. Arrows indicate the neurite-like extensions detectable in cells wt and in controls (Magnification 20× left panels, 40× right panels).
Figure 4
Figure 4. Over-expression of CHL1 inhibits proliferation of NB cells
(A) Protein lysates from IMR-32 cells wt, or transfected with pCEFL or with pCEFL-CHL1 were collected and subjected to GST-PAK pull-down assay and anti-Rac or anti-Cdc42 Western blot analysis. The same protein lysates were blotted again and probed with anti-phospho-p38, anti-phospho-JNK, and anti-phospho-Akt antibodies. Lower numbers indicate densitometric values normalized to each total protein expression. (B) IMR-32 wild type or transfected with pCEFL or with pCEFL-CHL1 were subjected to Western blot and probed with anti-PARP antibody to test apoptosis. The level of apoptosis assessed by the cleaved-PARP was greater in IMR-32 cells transfected with pCEFL-CHL1 than in IMR-32 wt or transfected with pCEFL. (C) TUNEL-positive cells were examined by fluorescence microscopy (Magnification 60×). Staining with TUNEL (green) revealed chromatin condensation and the typical morphological changes characteristic of apoptosis (arrow). Quantitative analysis of apoptosis was carried out by counting TUNEL-positive and negative cells. Nuclei were counterstained with DAPI (blue) (Three independent experiments ± SD). (D) IMR-32 cells wt, or transfected with pCEFL or with pCEFL-CHL1 were plated in 12-well plastic plates and cultured for 4 days. Every day, cells were trypsinized and counted. Data are representative of three independent experiments ± S.D. (E) IMR-32 cells wt or transfected with pCEFL or with pCEFL-CHL1 were subjected to the [3H]thymidine incorporation assay. Cells were analyzed with a β-counter to quantify the amount of radioactivity incorporated after 18 hours of incubation (cpm = counts per minute). (Three independent experiments ± S.D). (F) Immunofluorescence analysis of proliferating cells using anti-Ki67 (green). Cells were counterstained with DAPI to visualize nuclei (blue). (Magnification 40×). (Three independent experiments ± SD).
Figure 5
Figure 5. Down-regulation of CHL1 expression enhances growth of NB cells
(A) Protein lysates from HTLA-230 cells wt, or transfected with sh-ns or with sh-CHL1, were subjected to GST-PAK pull-down assay and anti-Rac or anti-Cdc42 Western blot analysis. The same lysates were blotted again and probed with anti-phospho-p38, anti-phospho-JNK, and anti-phospho-Akt antibodies. Lower numbers indicate densitometric values normalized to each total protein expression. (B) HTLA-230 cells wt, or transfected with sh-ns or with sh-CHL1 were cultured for 4 days. Every day cells were trypsinized and counted (Three independent experiments ± S.D). (C) HTLA-230 cells wt, or transfected with sh-CHL1 or with sh-ns were subjected to the [3H]thymidine incorporation assay (cpm = counts per minute) (Three independent experiments ± S.D). (D) Immunofluorescence analysis of proliferating cells using anti-Ki67 (green). Cells were counterstained with DAPI to visualize nuclei (blue). (Magnification 40×). (Three independent experiments ± SD).
Figure 6
Figure 6. CHL1 expression influences NB cells migration and invasion
(AB) Migration assay for IMR-32 cells wt or transfected with pCEFL or with pCEFL-CHL1 (48 or 72 hours after transfection) (A) and for HTLA-230 cells wt or transfected with sh-ns or with sh-CHL1 (B). Cells were seeded on the upper chamber of a transwell insert and 24 hours later, migrated cells were detached from the lower side of the insert, collected and counted (Three independent experiments ± S.D). (CD) Wound healing assay for IMR-32 cells wt or transfected with pCEFL or with pCEFL-CHL1 (C) and for HTLA-230 cells wt or transfected with sh-ns or with sh-CHL1 (D). Cells monolayers were scratched diagonally through the center of each well with a sterile tip (0 h) and photographed every 24 hours for 3 days under the light microscope (Magnification 4×).
Figure 7
Figure 7. CHL1 expression affects colony formation and anchorage independent growth of NB cells
(A) IMR-32 cells wt (1, 2), or transfected with pCEFL (3, 4), or with pCEFL-CHL1 (5, 6) were cultured for 15 days. The morphological characteristics of colonies were visualized by light microscope (1, 3, 5) (Magnification 4×), and the colonies were stained with crystal violet for quantification (2, 4, 6). (B) IMR-32 cells wt (1), or transfected with pCEFL (2) or with pCEFL-CHL1 (3) were cultured in soft agar for 20 days (Magnification 4×). (C) Colonies in HTLA-230 cells wt (1, 2), or transfected with sh-ns (3, 4), or with sh-CHL1 (5, 6) after 15 days culture. (D) Colonies in HTLA-230 cells wt (1) or transfected with sh-ns (2) or with sh-CHL1 (3) cultured in soft agar for 20 days. Histograms show mean colony numbers from three independent experiments ± S.D.
Figure 8
Figure 8. CHL1 decreases NB growth in vivo
(A) Representative images of orthotopic NB tumors formed by IMR-32 cells wt, or transfected with pCEFL-CHL1, or with empty vector pCEFL, after 28 days from implantation. The average volume of tumors formed by IMR-32 cells transfected with pCEFL-CHL1 cells was smaller than that formed by control cells. (B) Representative images of orthotopic NB tumors formed by HTLA-230 cells wt, or transfected with sh-CHL1, or with empty vector sh-ns after 21 days from implantation. The average volume of tumors formed by HTLA-230 cells transfected with sh-CHL1 cells was larger than that formed by control cells. After 3 or 4 weeks, all mice were sacrificed and final tumor tissues were photographed. Tumor volumes were recorded with a caliper and were calculated according to the formula volume = π/6[ω1x(ω2)2]. The significance of differences between experimental groups and controls was determined by the unpaired t-test. (C) CHL1 protein located on the cell surface (green) as assessed by immunofluorescence with specific mAb in orthotopic tumors formed by IMR-32 cells wt (1) or transfected with pCEFL-CHL1 (2) or by HTLA-230 cells wt (3) or transfected with sh-CHL1 (4) (Magnification 40×). (D) Representative images showing the morphological appearance of the orthotopic tumors stained with hematoxylin/eosin. NB tumors developed by implantation of IMR-32 cells wt (1) or transfected with pCEFL-CHL1. The inset shows an enlargement of some differentiating cells (arrow) (2). NB tumors formed by implantation of HTLA-230 cells wt (3) or transfected with sh-CHL1 (4).
Figure 9
Figure 9. In vivo characterization of orthotopic NB
(A) Immunohistochemistry analysis of MAP2 expression in orthotopic NB obtained by implantation of IMR-32 cells wt or transfected with pCEFL-CHL1. (B) Apoptotic cells in NB formed by implantation of IMR-32 cells wt or transfected with pCEFL-CHL1. TUNEL-positive apoptotic cells were detected by localized green fluorescence within cell nuclei counterstained with DAPI (blue) (Magnification 40×). (C) MAP2 immunohistochemical staining in NB obtained by implantation of HTLA-230 cells wt or transfected with sh-CHL1. (D) Ki67 immunohistochemical staining in NB formed by implantation of HTLA-230 cells wt or transfected with sh-CHL1. The histograms represent the percentage of MAP2+, Ki67+ and TUNEL+ cells.
Figure 10
Figure 10. Proposed CHL1 signaling model
In this model, CHL1 binds to yet unknown ligands and inhibits the activation of Rho GTPases, of related p38/JNK MAPK pathways, and of p-Akt. These events, in turn, result into enhanced tumor cell apoptosis and autophagy, differentiation, adhesion and neurite outgrowth, as well as into dampened cell proliferation and motility and tumor progression.

References

    1. Cheung NK, Dyer MA. Neuroblastoma: developmental biology, cancer genomics and immunotherapy. Nat Rev Cancer. 2013;13:397–411. - PMC - PubMed
    1. Smith MA, Seibel NL, Altekruse SF, Ries LA, Melbert DL, O'Leary M, Smith FO, Reaman GH. Outcomes for children and adolescents with cancer: challenges for the twenty-first century. J Clin Oncol. 2010;28:2625–2634. - PMC - PubMed
    1. Pezzolo A, Sementa AR, Lerone M, Morini M, Ognibene M, Defferrari R, Mazzocco K, Conte M, Gigliotti AR, Garaventa A, Pistoia V, Varesio L. Constitutional 3p26.3 terminal microdeletion in an adolescent with neuroblastoma. Cancer Biol Ther. 2017;18:285–289. - PMC - PubMed
    1. Spitz R, Hero B, Ernestus K, Berthold F. Deletions in chromosome arms 3p and 11q are new prognostic markers in localized and 4s neuroblastoma. Clin Cancer Res. 2003;9:52–58. - PubMed
    1. Ejeskar K, Aburatani H, Abrahamsson J, Kogner P, Martinsson T. Loss of heterozygosity of 3p markers in neuroblastoma tumours implicate a tumour-suppressor locus distal to the FHIT gene. British Journal of Cancer. 1998;77:1787–1791. - PMC - PubMed