Review
. 2018 Apr 9;9(20):4546-4554.
doi: 10.1039/c8sc01035h. eCollection 2018 May 28.

Electrochemical imaging of cells and tissues

Affiliations
Review

Electrochemical imaging of cells and tissues

Tzu-En Lin et al. Chem Sci. .

Abstract

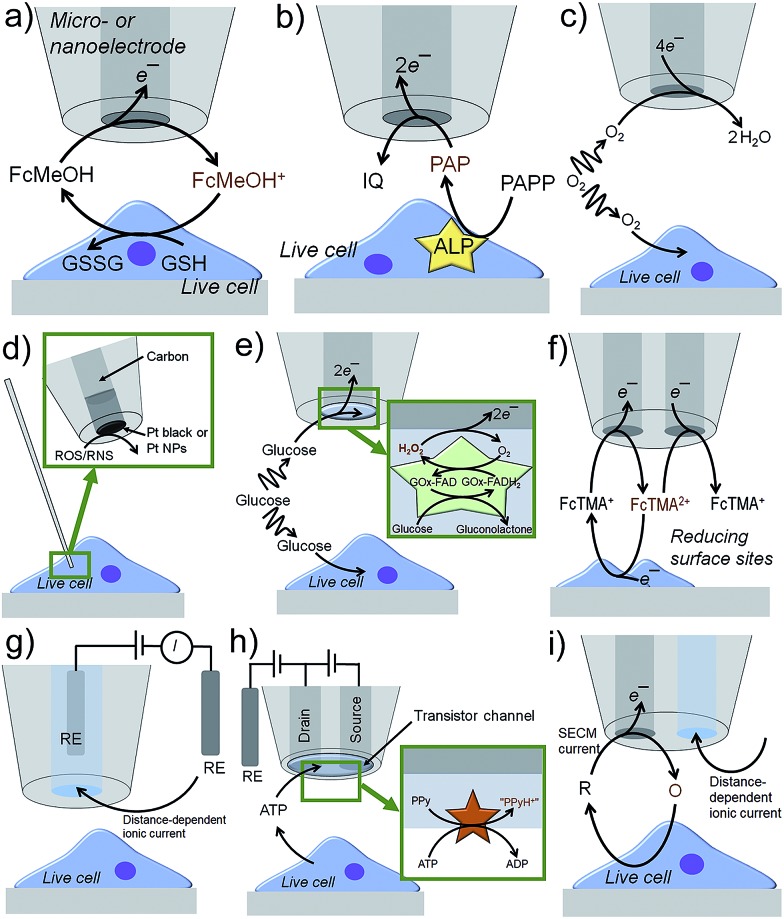
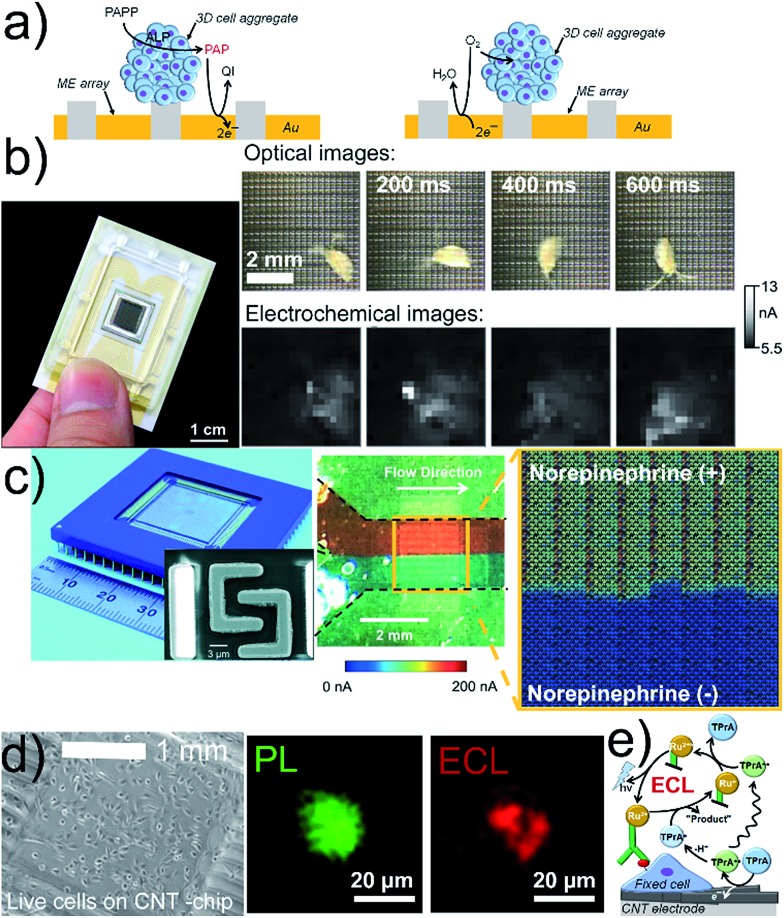
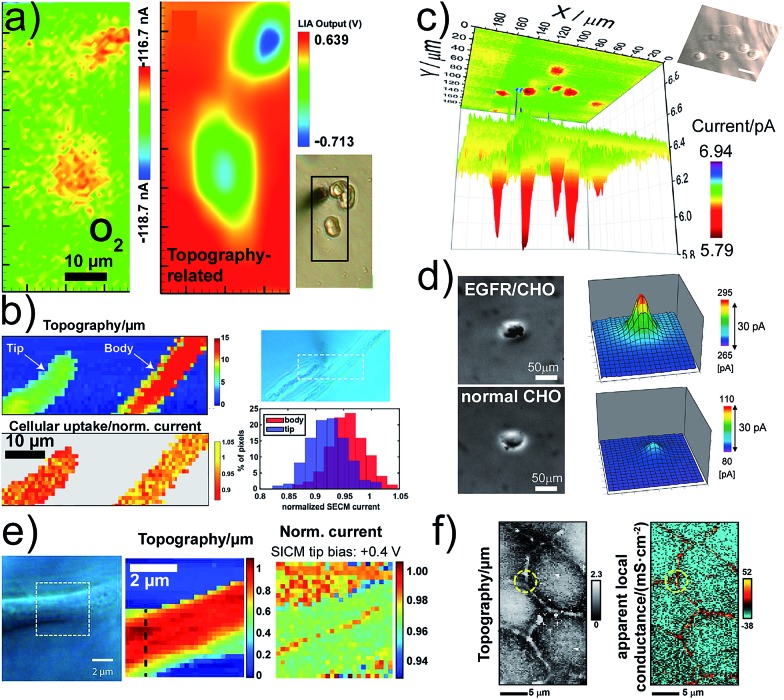
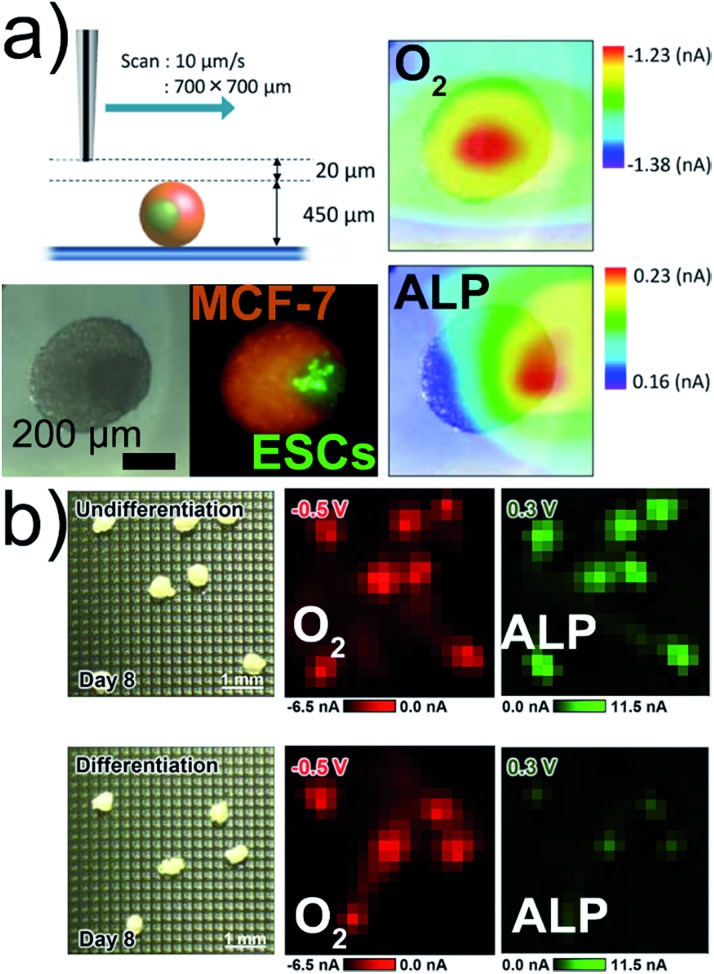
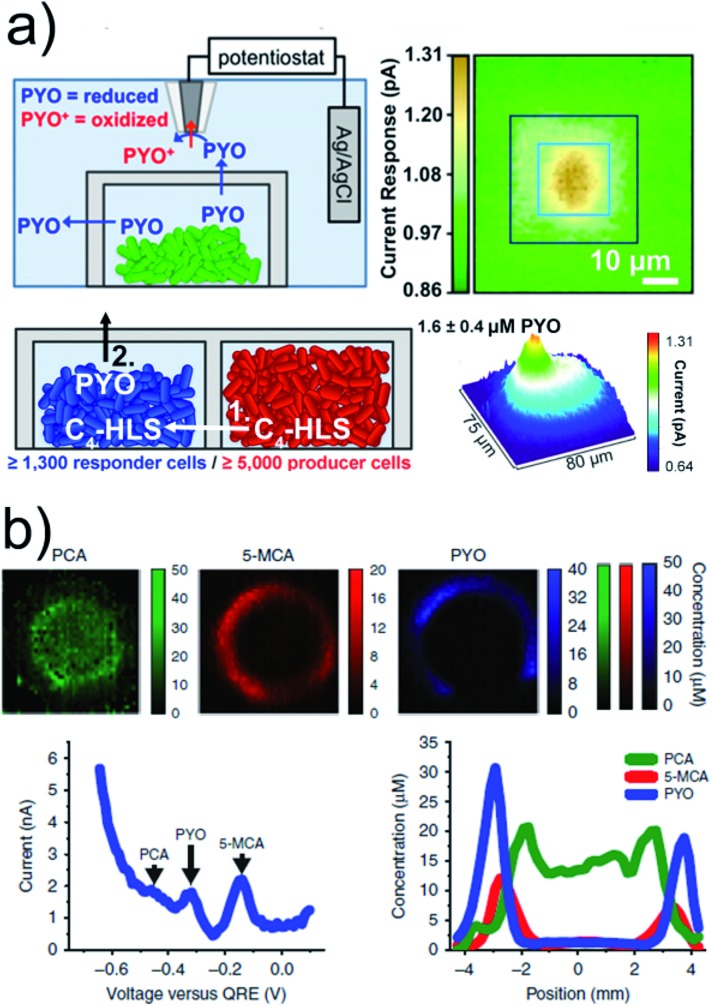
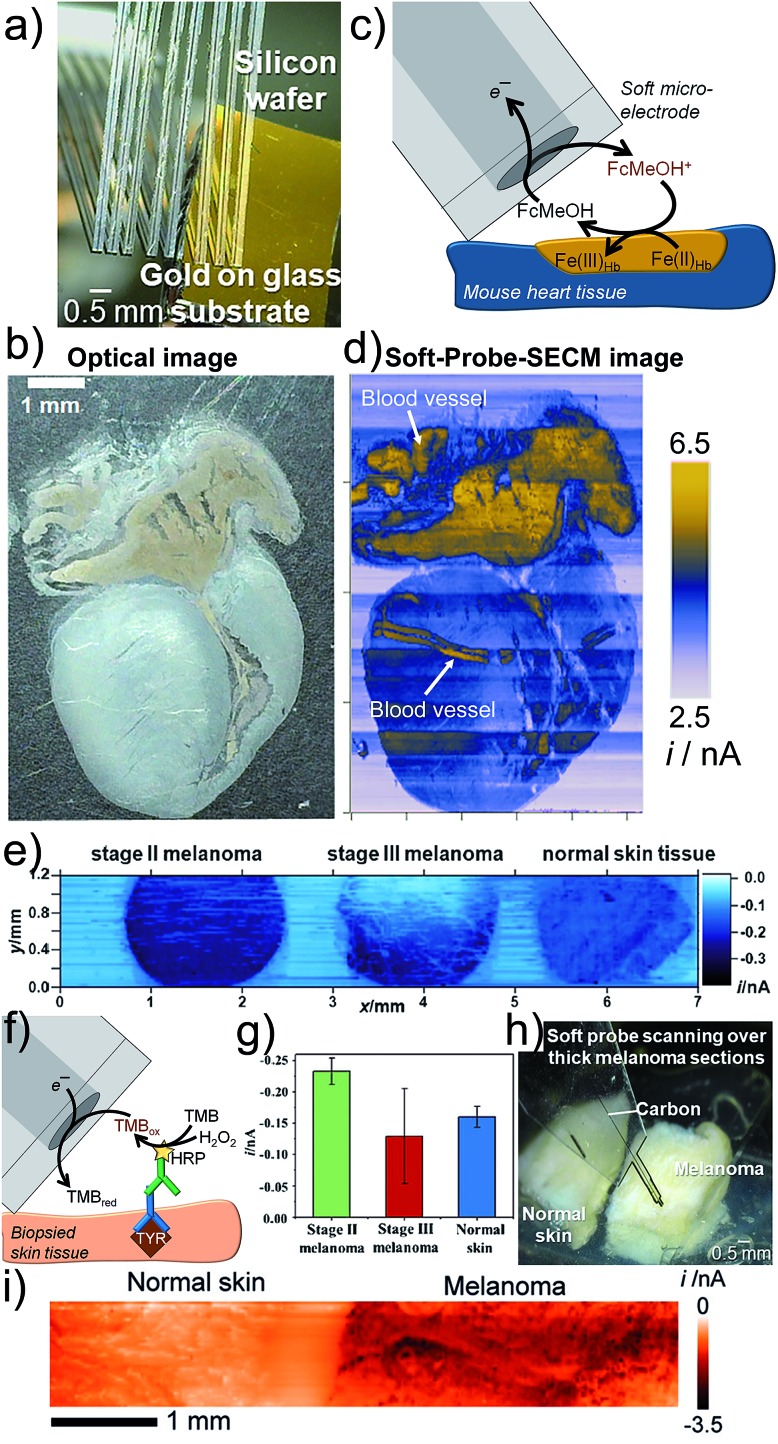
The technological and experimental progress in electrochemical imaging of biological specimens is discussed with a view on potential applications for skin cancer diagnostics, reproductive medicine and microbial testing. The electrochemical analysis of single cell activity inside cell cultures, 3D cellular aggregates and microtissues is based on the selective detection of electroactive species involved in biological functions. Electrochemical imaging strategies, based on nano/micrometric probes scanning over the sample and sensor array chips, respectively, can be made sensitive and selective without being affected by optical interference as many other microscopy techniques. The recent developments in microfabrication, electronics and cell culturing/tissue engineering have evolved in affordable and fast-sampling electrochemical imaging platforms. We believe that the topics discussed herein demonstrate the applicability of electrochemical imaging devices in many areas related to cellular functions.


Figures

Fig. 1
Fig. 1. Operation principles of typical electrochemical SPMs. (a) SECM feedback (FB) mode. (b) SECM substrate generation/tip collection (SG/TC) mode. (c) SECM redox (RC) competition mode. (d) Pt-Based nanoelectrode for non-invasive intracellular recordings. (e) Microbiosensor for specific metabolite detection. (f) Dual electrode SECM tip. (g) SICM for topographic mapping. (h) Nano-FET for specific metabolite detection. (i) SECM-SICM for constant distance mode electrochemical imaging. Please note that all schemes are not true to scale. Species written in brown color code were generated during the analysis for electrochemical detection.
Fig. 2
Fig. 2. (a) G/C (left) and RC (right) modes for electrochemical imaging on a chip. (b) 400-ME array chip with an external RE and CE (left) used to track the movement of Daphnia magna (right). The oxidation current of [Fe(CN)6]4– was recorded and perturbed by the motion of Daphnia magna. (c) Optical image of a CMOS chip containing 64 subarrays each with 128 Pt MEs and shared RE and CE (left), and SEM image (left, inset) of two interdigitated Pt MEs. Optical image (center) and electrochemical image (right) of a bimodal gradient of two solutions with (+red dye) and without norepinephrine (+blue dye) in neurobasal media. Dashed black lines indicate the walls of a microfluidic channel placed on the chip. Oxidation potential for norepinephrine: +0.6 V vs. Pt. (d) Inkjet-printed transparent CNT electrode on plastic with MCF10A cells. Photoluminescence (PL) and ECL images of a MCF10A cell labeled with a cell membrane antibody (Ab) with Ru in 0.2 M phosphate buffer with 200 mM TPrA. Electrode potential: +1.35 V vs. Ag/AgCl/KCl 3 M. (e) Scheme of ECL principle. (b) Adapted with permission from ref. 57 (left) and ref. 31 (right). Copyright 2017 American Chemical Society (left) and John Wiley and Sons. (c) Adapted with permission from ref. 32. Copyright 2015 Royal Society of Chemistry. (d) Adapted with permission from ref. 33. Copyright 2017 American Chemical Society.
Fig. 3
Fig. 3. (a) Electrochemical (FSCV) and topographic (AC-impedance) imaging of PC12 cells. (b) Cellular uptake of [Ru(NH3)6]3+ as normalized SECM current of single Zea mays root hair cells and cell topography. (c) Electrochemical imaging of glucose uptake by single MCF10A cells using a GOx-based Pt-ME-biosensor. (d) Detection of Chinese hamster ovary (CHO) normal cells (upper panels) and transformed EGFR/CHO cells. The ALP/Ab-EGFR-complex was imaged by the electrochemical detection of PAP. (e) SICM mapping of an AbSc cell to detect surface charge heterogeneities on the cell surface. (f) Potentiometric-SICM mapping of the apparent local conductance to identify paracellular and transcellular pathways of ion transport between Madin-Darby Canine Kidney strain II cells. (a–f) Adapted with permissions from ref. 45, 53, 16, 54, 22 and 55. Copyright 2009, 2012, 2016 and 2017 American Chemical Society.
Fig. 4
Fig. 4. (a) SECM, optical, and fluorescence imaging of a co-culture Janus spheroid fused on day 3 (250ESC–2000MCF-7). Respiration activity (O2) imaging at –0.5 V and ALP activity imaging at +0.3 V. (b) Electrochemical imaging of O2 and ALP activities of EBs. All potentials vs. Ag/AgCl. Adapted with permission from ref. 7 and 57. Copyright (a) 2013 and (b) 2017 American Chemical Society.
Fig. 5
Fig. 5. (a) Upper panels: SECM imaging of PYO (∼2.7 μM) release from a P. aeruginosa aggregate in a microtrap. The SECM tip was biased at 0 V vs. Ag/AgCl to oxidize PYO. Lower panels: PYO was used as a proxy for P. aeruginosa QS-controlled communication between physically separated populations using two mutant strains. Aggregates of ≥5000 Δphz cells induced PYO production in the neighbouring ΔrhlI aggregate. (b) Electrochemical imaging of 2 day anaerobically grown ΔphzH biofilms after 4.25 h of oxygenation based on SWV. Phenazine concentration was calculated from the peak currents. Bottom left: exemplary SWV with peak indication. Bottom right: exemplary cross-section from the electrochemical image. (a) Adapted with permission from ref. 65. Copyright 2014 National Academy of Sciences. (b) Adapted from ref. 67. Copyright 2016 Springer Nature.
Fig. 6
Fig. 6. Soft-Probe-SECM imaging of (a–d) a mouse heart section and (e–i) skin tissue. (a) Soft linear ME array. (b) Optical photograph. (c) FB mode imaging where FcMeOH is regenerated by redox active proteins in the tissue. (d) Soft-Probe-SECM image. (e) Soft-Probe-SECM imaging of the distribution of the diagnostic melanoma biomarker tyrosinase in normal skin and stage II and stage III melanoma slices using an immunoassay-adapted strategy (f). Nine values per tissue were used to create the bar plot in (g). (h and i) Soft-Probe-SECM imaging of thick normal skin and melanoma tissue. Adapted with permission from ref. 70 and 71. Copyright 2016 and 2017 John Wiley and Sons.

References

    1. Polcari D., Dauphin-Ducharme P., Mauzeroll J. Chem. Rev. 2016;116:13234–13278. - PubMed
    1. Hansma P. K., Drake B., Marti O., Gould S. A. C., Prater C. B. Science. 1989;243:641–643. - PubMed
    1. Clausmeyer J., Schuhmann W. Trends Anal. Chem. 2016;79:46–59.
    1. Kwak J., Bard A. J. Anal. Chem. 1989;61:1221–1227.
    1. Zhao C., Wittstock G. Angew. Chem., Int. Ed. 2004;43:4170–4172. - PubMed

LinkOut - more resources