. 2018 Mar 6;7(7):e1438111.
doi: 10.1080/2162402X.2018.1438111. eCollection 2018.

Dynamic change of PD-L1 expression on circulating tumor cells in advanced solid tumor patients undergoing PD-1 blockade therapy

Affiliations

Dynamic change of PD-L1 expression on circulating tumor cells in advanced solid tumor patients undergoing PD-1 blockade therapy

Chunyan Yue et al. Oncoimmunology. .

Abstract

Background: Tumor PD-L1 levels have predictive value in PD-1/PD-L1 checkpoint blockade therapies, yet biopsies can only provide baseline information. Whether PD-L1 expression on circulating tumor cells (CTCs) could serve as an alternative biomarker is of great interest. Design: We established an immunofluorescence assay for semi-quantitative assessment of the PD-L1 expression levels on CTCs with four categories (PD-L1negative, PD-L1low, PD-L1medium and PD-L1high). 35 patients with different advanced gastrointestinal tumors were enrolled in a phase 1 trial of a PD-1 inhibitor, IBI308. The CTC numeration and the PD-L1 expression levels were analyzed. Results: Prior the treatment of IBI308, 97% (34/35) patients had CTCs, ranging from1 to 70 (median 7). 74% (26/35) had PD-L1positive CTCs, and 60% (21/35) had at least one PD-L1high CTCs. The disease control (DC) rate in PD-L1high patients (48%) is much higher than the others (14%). The group with at least 20% abundance of PD-L1high CTCs had even higher DC rate of 64% (9/14), with only 14% DC rate for the rest (3/21). We also observed that the count changes of total CTC, PD-L1postive CTC and PD-L1high CTC correlate quite well with disease outcome (P<0.001, P = 0.002 and 0.007, respectively). In addition, the abundance of PD-L1high CTCs at baseline had predicative significance for progression free survival (PFS). Conclusions: We revealed that the abundance of PD-L1high CTCs at baseline might serve as a predictor to screen patients for PD-1/PD-L1 blockade therapies and measuring the dynamic changes of CTC could indicate the therapeutic response at early time.

Keywords: advanced solid tumor; circulating tumor cells (CTCs); immunotherapy; programmed death-ligand 1 (PD-L1); semi-quantitative analysis.


Figures
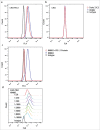
Figure 1.
Figure 1.
Specificity and sensitivity assessment of the PD-L1 mAb KN802. (a, b) KN802, the available PD-L1-specific antibody Dako 22C3 and species-matched isotype negative control were tested in PD-L1 overexpressed CHO-PDL1 and negative CHO cell lines with FCM. (c) Active binding sites of KN802 were blocked by co-incubation with PD-L1 recombinant protein. In parallel, unblocked KN802 and corresponding isotype were tested as positive and negative control, respectively. (d) KN802 was titrated to determine the sensitivity in a series concentration. The highest signal was observed at the diluted concentration of 1: 1000, which was chosen as the optimal working concentration.
Figure 2.
Figure 2.
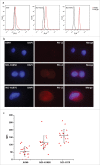
Development of PD-L1 quantitative assay. (a) PD-L1 levels in three lung-cancer derived cell lines were determined using FCM, with low for A549, medium for NCI-H1650 and strong for NCI-H1975. (b) Construction of the PD-L1 quantitative system. Three cell lines with different PD-L1 levels were spiked into blood samples from health donors and recovered by Pep@MNPs. The staining signals were observed under fluorescence microscope. (c) MFI of the recovered cells. The MFI of A549, NCI-H1650, NCI-H1975 is 55.24±33.36, 113.07±48 and 160.87±44.86, respectively.
Figure 3.
Figure 3.
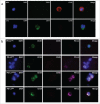
Assessment of PD-L1 expression on CTCs. (a) Represent CTC enriched with Pep@MNPs. WBC: white blood cell, characterized by DAPI+ CK19- CD45+; CTC: circulating tumor cell, characterized by DAPI+ CK19+ CD45-. (b) Represent CTCs with different PD-L1 levels isolated from one patient. In order from top to bottom, it was PD-L1 negative (PD-L1neg), lowly expressed (PD-L1low), medially expressed (PD-L1medium) and strongly expressed (PD-L1high) CTC, respectively.
Figure 4.
Figure 4.
Correlation between baseline proportions of total PD-L1pos CTC/PD-L1high CTC counts and disease status.(a) PD-L1 distribution on CTCs from advanced cancer patients before initiation of IBI308 therapy. DC: disease control, refer to patients showed response (PR and SD); PD: progressive disease, refer to patients showed no response. Patients are ordered according to the percentage of PD-L1high CTCs. The dash dot line refers to the cutoff proportion of PD-L1high CTCs. (b) Response rate of patients with/without PD-L1high CTCs at baseline. (c) Response rate of patients above or below the cutoff value. (d) Percentage distribution of total PD-L1pos CTCs at baseline before IBI308 therapy. The ratio ranged from 0 to 87.5% in DC group, with an average value of 45.85±30.45%. And PD group showed a range from 0 to 76.19% and the average value was 27.12 ± 25.50%. No significant correlation was observed between baseline proportion of PD-L1 positive CTCs and drug response (R = 0.319, P = 0.066). (e) Ratio distribution of PD-L1high CTCs at baseline from patients before IBI308 therapy. The ratio ranged from 0 to 80% in DC group, with a mean value of 31.01 ± 25.80%. And PD group showed a range from 0 to 50% and the average value was 13.33 ± 19.85%. A higher ratio of PD-L1high CTCs at baseline is positively correlated to a better drug response (R = 0.407, P = 0.017).
Figure 5.
Figure 5.
Dynamic changes in PD-L1 distribution on CTCs before and after treatment. (a) Changes of total CTC count in DC and PD patients. An increase (≥0) was observed in 27.27% (3/11) DC patients and 89.47% (17/19) PD patients. P<0.001. (b) Changes of total PD-L1positive CTC count in DC and PD patients. 54.55% DC patients (6/11) showed a decline of total PD-L1 positive CTCs, while an increase occurred in 18 of 19 PD patients. P = 0.002. (c) Changes of PD-L1high CTC count in DC and PD patients. A decline was observed in 63.64% DC patients (7/11) while an augment was found in 84.21% PD patients (16/19). P = 0.007. (d) Changes of CTC count in two specific cases. For a triple bar of one patient, it was CTCs enumerated at T0, T1 and T2 in order from left to right. (e) Ratio distribution of PD-L1positive CTCs at T0 (baseline) and T1 (after treatment). An obviously increase was observed both in PD group at T1 compared with T0 (from 25.60 ± 24.39% to 52.12 ± 32.76%, P = 0.015); and DC group showed no significant ratio change (from 42.06 ± 28.82% to 43.20 ± 31.37%, P = 0.933). (f) Ratio distribution of PD-L1high CTCs at T0 (baseline) and T1 (after treatment). Two separate drifts were observed between DC and PD groups. At T1, the average proportion of PD-L1high CTCs showed a dramatic augment in PD group (from 14.44 ± 21.50% to 34.10 ± 35.15%, P = 0.043) and a decline in DC group (from 27.01 ± 22.82% to 16.01 ± 22.42%, P = 0.273).
Figure 6.
Figure 6.
Kaplan–Meier estimates of PFS of patients with abundance of PD-L1high CTCs ≥ or < 20% at T0.
Scheme 1.
Scheme 1.
Schematic illustration of PD-L1 positive CTCs as a biomarker in PD-1/PD-L1 blockade therapy.

References

    1. Zou W, Wolchok JD, Chen L. PD-L1 (B7-H1) and PD-1 pathway blockade for cancer therapy: Mechanisms, response biomarkers and combinations. Sci Translational Med. 2016;8:328rv4–rv4. doi:10.1126/scitranslmed.aad7118 - DOI - PMC - PubMed
    1. Chiavenna SM, Jaworski JP, Vendrell A. State of the art in anti-cancer mAbs. J Biomed Sci. 2017;24:15. doi:10.1186/s12929-016-0311-y. PMID:28219375. - DOI - PMC - PubMed
    1. Hwang YY, Khong PL, Kwong YL. Low-dose nivolumab induced remission in refractory classical Hodgkin lymphoma. Ann Hematol. 2017;96:1219–20. doi:10.1007/s00277-017-3007-9. PMID:28434018. - DOI - PubMed
    1. Weinstock C, Khozin S, Suzman D, Zhang L, Tang S, Wahby S, Goldberg KB, Kim G, Pazdur R. U.S. food and drug administration approval summary: Atezolizumab for metastatic non-small cell lung cancer. Clin Cancer Res. 2017;23(16):4534–4539. doi:10.1158/1078-0432.CCR-17-0540. PMID:28611199. - DOI - PubMed
    1. Maraz A, Geczi L. [The role of immunotherapy in the modern treatment of urothelial carcinoma]. Magyar Onkologia. 2017;61:139–46. PMID:28585615. - PubMed

Publication types