. 2018 Mar 26;7(7):e1445454.
doi: 10.1080/2162402X.2018.1445454. eCollection 2018.

D-2-hydroxyglutarate interferes with HIF-1α stability skewing T-cell metabolism towards oxidative phosphorylation and impairing Th17 polarization

Affiliations

D-2-hydroxyglutarate interferes with HIF-1α stability skewing T-cell metabolism towards oxidative phosphorylation and impairing Th17 polarization

Martin Böttcher et al. Oncoimmunology. .

Abstract

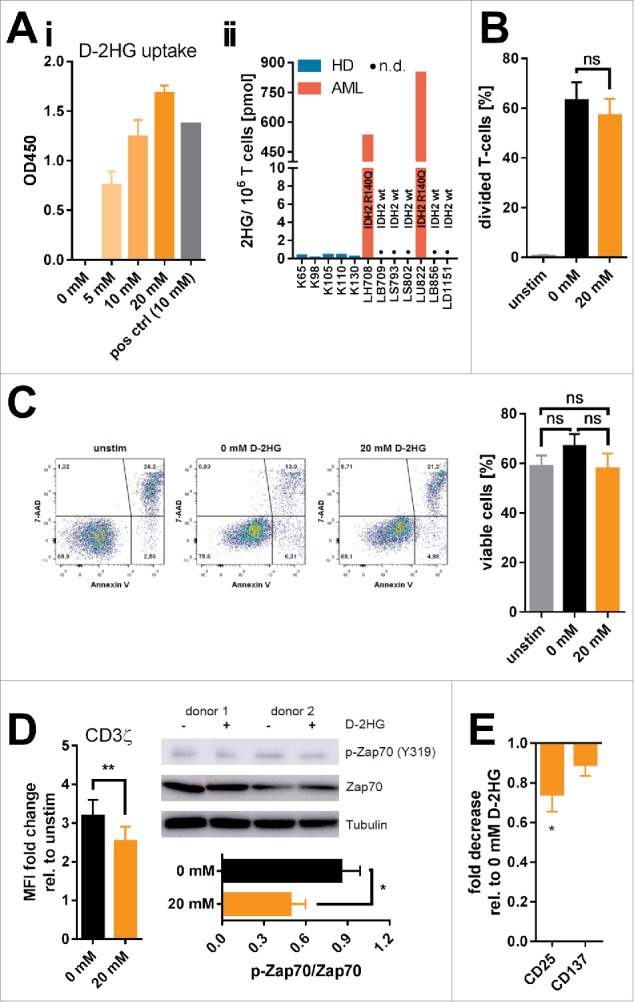
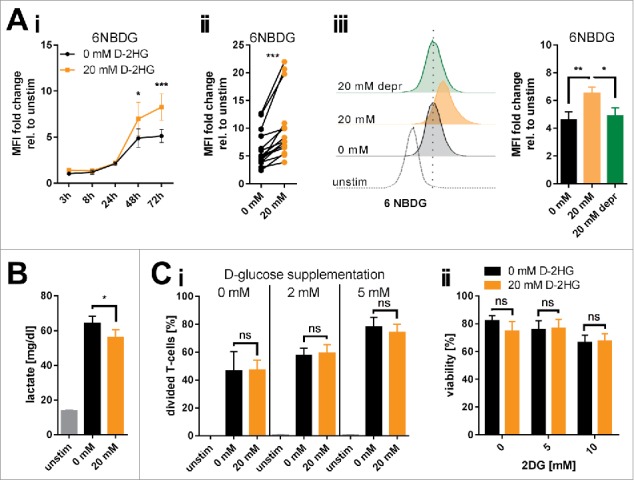
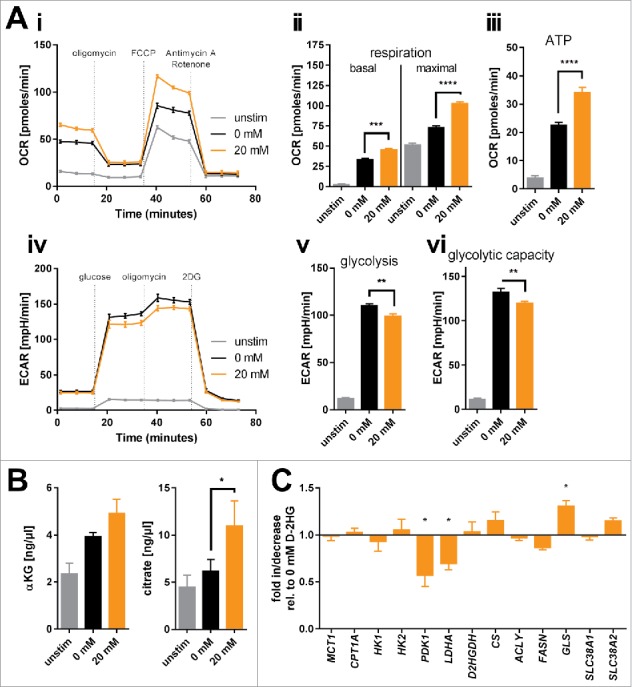
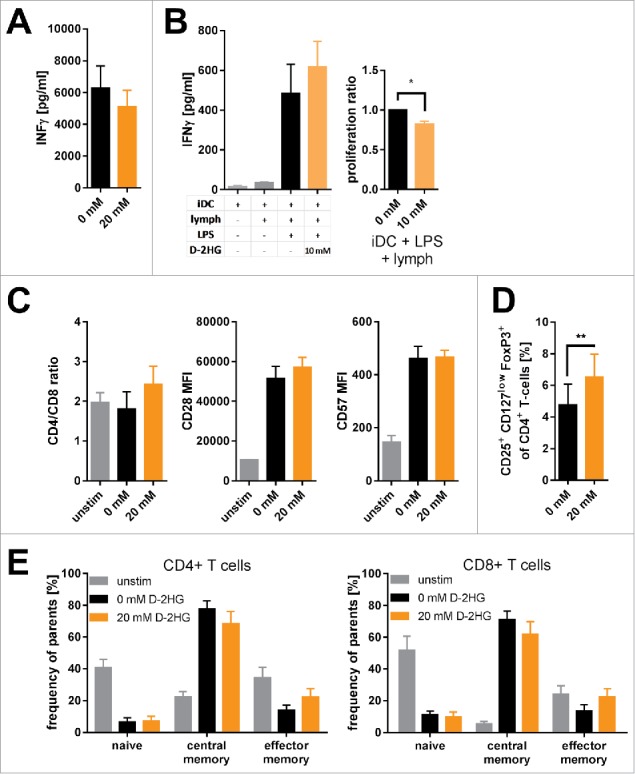
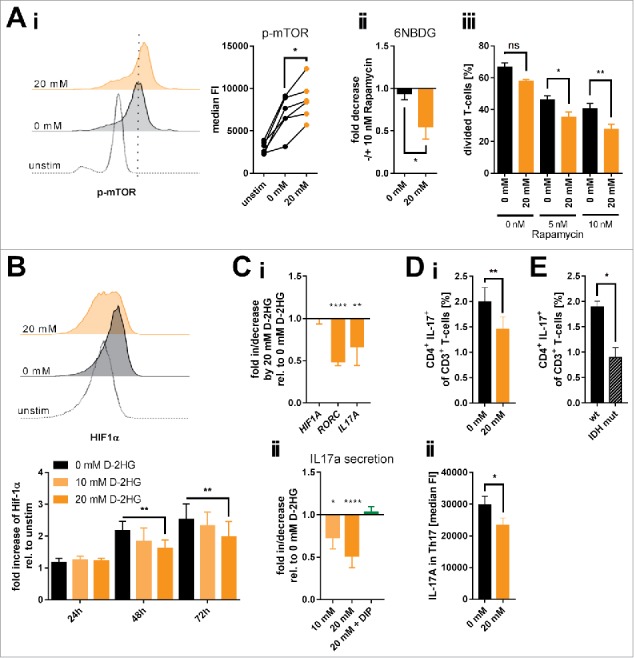
D-2-hydroxyglutarate (D-2HG) is released by various types of malignant cells including acute myeloid leukemia (AML) blasts carrying isocitrate dehydrogenase (IDH) gain-of-function mutations. D-2HG acting as an oncometabolite promotes proliferation, anoikis, and differentiation block of hematopoietic cells in an autocrine fashion. However, prognostic impact of IDH mutations and high D-2HG levels remains controversial and might depend on the overall mutational context. An increasing number of studies focus on the permissive environment created by AML blasts to promote immune evasion. Impact of D-2HG on immune cells remains incompletely understood. Here, we sought out to investigate the effects of D-2HG on T-cells as key mediators of anti-AML immunity. D-2HG was efficiently taken up by T-cells in vitro, which is in line with high 2-HG levels measured in T-cells isolated from AML patients carrying IDH mutations. T-cell activation was slightly impacted by D-2HG. However, D-2HG triggered HIF-1a protein destabilization resulting in metabolic skewing towards oxidative phosphorylation, increased regulatory T-cell (Treg) frequency, and reduced T helper 17 (Th17) polarization. Our data suggest for the first time that D-2HG might contribute to fine tuning of immune responses.

Keywords: 2HG; IDH mutation; Immunosurveillance; Inflammation and cancer; Th17; Tregs; acute myeloid leukemia; immunometabolism; oncometabolite.


Figures

Figure 1.
Figure 1.
Uptake and influence of exogenous D-2HG on survival, proliferation, and activation of T-cells. A) The uptake of D-2HG, exogenously supplied at different concentrations to T-cell cultures (stimulated with anti-CD2/CD3/CD28 coated beads), was measured after an incubation time of 72 h by a colorimetric enzymatic assay (Ai, n = 3). Additionally, intracellular total 2HG (D- and S-enantiomer) levels of T-cells isolated from healthy donors (HD) and AML patients (AML) were quantified by liquid chromatography-mass spectrometry (Aii). Cells were furthermore analyzed regarding the effects on proliferation (B; n = 6), survival (C; n = 11), T-cell receptor signaling (D; n = 4-7), and activation-related surface marker expression as measured by FACS (E; n = 10) upon D-2HG treatment. T-cells were either unstimulated (unstim, grey bars) or stimulated without (0 mM, black) or with (orange) D-2HG at indicated concentrations. FACS plots show analyses from a representative experiment. The Western Blot image shows two representative donors from a total of four. * p < 0.05; ** p < 0.01; ns: not significant; n.d.: not detected.
Figure 2.
Figure 2.
Changes of glucose metabolism induced by exogenous D-2HG. A) The increase in glucose uptake induced by 20 mM D-2HG supplementation was measured by flow cytometry (FACS) using a fluorescent glucose analog (6NBDG) in a time course (Ai, n = 5-11) or after 72 h (Aii, n = 15) of T-cell culture. D-2HG was subsequently removed from the culture and glucose uptake levels measured again after 72 h (Aiii, 20 mM depr, green bar, n = 5). Each pair of values in panel ii represents T-cells isolated from one particular donor under different culturing conditions. B) Lactate secretion into the cell culture supernatant as a surrogate for glycolysis was measured after 72 h (B, n = 10). C) To evaluate a putative glucose-dependency created by exogenous D-2HG application T-cells were analyzed in terms of their proliferative capacity in presence of reduced glucose availability in the culture medium (Ci, n = 3), and of viability upon hexokinase-2 inhibition by 2DG (Cii, n = 3) after 72 h of culture. T-cells were either unstimulated (unstim, grey) or stimulated without (0 mM, black) or with (20 mM, orange) D-2HG. FACS histograms show one representative analysis. * p<0.05; ** p<0.01; *** p<0.001; ns: not significant.
Figure 3.
Figure 3.
Bioenergetic modulation of T-cells by exogenous D-2HG. A) Mitochondrial respiration of T-cells cultured in the absence or presence of D-2HG for 72 h was analyzed in real-time using the Seahorse extracellular flux analyzer. Oxygen consumption rate (OCR) was recorded (Ai) and respiratory parameters were calculated (Aii-iii) after sequential addition of oligomycin, FCCP, and antimycin A/rotenone (n = 4). Likewise, extracellular acidification rate (ECAR) was assessed (Aiv) and glycolytic parameters were calculated (Av-vi) after sequential addition of glucose, oligomycin, and 2DG (n = 4). B) Intracellular concentrations of two representative intermediates of the TCA cycle (α-ketoglutarate: αKG, n = 3 and citrate, n = 5) were enzymatically determined. C) The expression of key metabolic genes was quantified by real-time PCR (n = 3-12). T-cells were either unstimulated (unstim, grey) or stimulated without (0 mM, black) or with (20 mM, orange) D-2HG. * p < 0.05; ** p < 0.01; *** p < 0.001; **** p < 0.0001.
Figure 4.
Figure 4.
Impact of exogenous D-2HG on T-cell function. A) IFNγ secretion by anti- CD2/CD3/CD28 stimulated T-cells was determined by sandwich ELISA (n = 9). B) Mixed lymphocyte reactions were performed to analyze T-cell function. Immature dendritic cells (iDC) were co-cultured with T-cells (lymph) with/without LPS in the absence (0 mM) or presence (10 mM) of D-2HG. Both, the secretion of IFNγ (left panel) and T-cell proliferation (right panel) were measured by sandwhich-ELISA and thymidine intake, respectively. C) The ratio of CD4+ to CD8+ T-cells as well as the surface expression of CD28 and CD57 were analyzed after 72 h of anti-CD2/CD3/CD28 stimulation by flow cytometry (FACS) to evaluate T-cell senescence (n = 3). D) The frequency of regulatory T-cells amongst pan T-cells after stimulation with anti-CD2/CD3/CD28 for 72 h was determined by FACS (n = 9). E) Frequency of naïve (CD45ROCCR7+), central memory (CD45RO+CCR7+) and effector memory (CD45RO+CCR7) T-cell subsets of CD4+ (left) and CD8+ (right) T-cells stimulated for 72 h with and without anti-CD2/CD3/CD28 were measured by FACS (n = 3). T-cells were either unstimulated (unstim, grey) or stimulated without (0 mM, black) or with (orange) D-2HG at indicated concentrations. * p<0.05; ** p<0.01.
Figure 5.
Figure 5.
Influence of exogenous D-2HG on mTOR activation, HIF-1α protein stability and resulting Th17 formation. A) Activation of the mTOR signaling pathway (Ai; n = 6) as a function of the level of mTOR phosphorylation (p-mTOR) and the impact of mTOR inhibition by rapamycin on glucose uptake (Aii; n = 4) and T-cell proliferation (Aiii; n = 3) upon D-2HG treatment were measured by flow cytometry (FACS). Each pair of values in panel i represents T-cells isolated from one particular donor under different culture conditions. B) In addition, HIF-1α protein expression levels were analyzed by FACS showing one representative FACS analysis after 72 h (upper panel) and the averages of repeated measures in a time-course (n = 3, lower panel). C) Relative gene expression of HIF1A, RORC, and IL17A (Ci, n = 8-23) and IL-17A secretion (Cii, n = 5-10) by in vitro cultured T-cells treated for 24 h with D-2HG were measured by quantitative real-time PCR and sandwich-ELISA, respectively. In addition, IL-17 secretion was measured in the presence of the hypoxia mimetic DIP that stabilizes HIF-1α (green bar). D) Anti-CD2/CD3/CD28 stimulated T-cells were restimulated after 72 h of culture with PMA/Ionomycin in the presence of GolgiPlug™ for 4 h and analyzed for the Th17 frequency (i, n = 8) and the intracellular IL-17 A content (ii, n = 8). E) Finally, PBMCs from AML patients without (wt) and with IDH mutation (IDH mut) were compared by flow cytometry for their Th17 frequency after 4 h of in vitro stimulation with PMA/Ionomycin in the presence of GolgiPlug™ (n = 3-7). T-cells were either unstimulated (unstim) or stimulated in the absence (0 mM, black) or presence (orange) of D-2HG at the given concentrations. FACS histograms show one representative analysis. * p<0.05; ** p<0.01; *** p<0.001; **** p<0.0001; ns: not significant.

References

    1. Yan H, Parsons DW, Jin G, McLendon R, Rasheed BA, Yuan W, Kos I, Batinic-Haberle I, Jones S, Riggins GJ, et al.. IDH1 and IDH2 mutations in gliomas. N Eng J Med. 2009;360:765–73. doi:10.1056/NEJMoa0808710. - DOI - PMC - PubMed
    1. Parsons DW, Jones S, Zhang X, Lin JC, Leary RJ, Angenendt P, Mankoo P, Carter H, Siu IM, Gallia GL, et al.. An integrated genomic analysis of human glioblastoma multiforme. Science. (New York, NY) 2008;321:1807–12. doi:10.1126/science.1164382. PMID:18772396. - DOI - PMC - PubMed
    1. Mardis ER, Ding L, Dooling DJ, Larson DE, McLellan MD, Chen K, Koboldt DC, Fulton RS, Delehaunty KD, McGrath SD, et al.. Recurring mutations found by sequencing an acute myeloid leukemia genome. N Eng J Med. 2009;361:1058–66. doi:10.1056/NEJMoa0903840. - DOI - PMC - PubMed
    1. Dang L, White DW, Gross S, Bennett BD, Bittinger MA, Driggers EM, Fantin VR, Jang HG, Jin S, Keenan MC, et al.. Cancer-associated IDH1 mutations produce 2-hydroxyglutarate. Nature. 2009;462:739–44. doi:10.1038/nature08617. PMID:19935646. - DOI - PMC - PubMed
    1. Ward PS, Patel J, Wise DR, Abdel-Wahab O, Bennett BD, Coller HA, Cross JR, Fantin VR, Hedvat CV, Perl AE, et al.. The common feature of leukemia-associated IDH1 and IDH2 mutations is a neomorphic enzyme activity converting alpha-ketoglutarate to 2-hydroxyglutarate. Cancer Cell. 2010;17:225–34. doi:10.1016/j.ccr.2010.01.020. PMID:20171147. - DOI - PMC - PubMed

Publication types