Clinical Trial
. 2018 Sep;18(9):2238-2249.
doi: 10.1111/ajt.14967. Epub 2018 Jul 10.

Dynamics of virus-specific T cell immunity in pediatric liver transplant recipients

Affiliations
Clinical Trial

Dynamics of virus-specific T cell immunity in pediatric liver transplant recipients

R J Arasaratnam et al. Am J Transplant. 2018 Sep.

Abstract

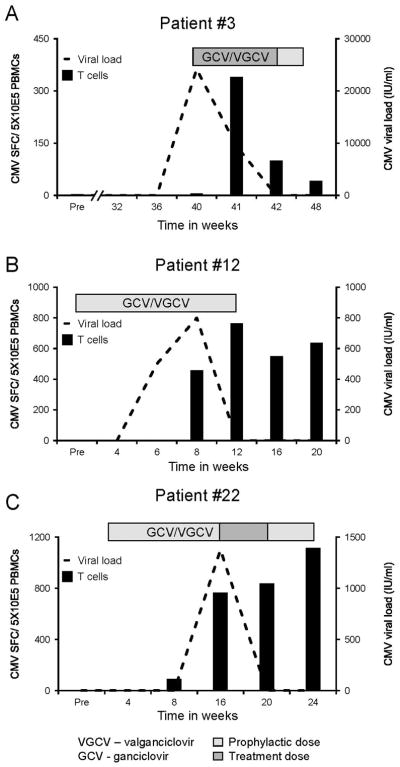
Immunosuppression following solid organ transplantation (SOT) has a deleterious effect on cellular immunity leading to frequent and prolonged viral infections. To better understand the relationship between posttransplant immunosuppression and circulating virus-specific T cells, we prospectively monitored the frequency and function of T cells directed to a range of latent (CMV, EBV, HHV6, BK) and lytic (AdV) viruses in 16 children undergoing liver transplantation for up to 1 year posttransplant. Following transplant, there was an immediate decline in circulating virus-specific T cells, which recovered posttransplant, coincident with the introduction and subsequent routine tapering of immunosuppression. Furthermore, 12 of 14 infections/reactivations that occurred posttransplant were successfully controlled with immunosuppression reduction (and/or antiviral use) and in all cases we detected a temporal increase in the circulating frequency of virus-specific T cells directed against the infecting virus, which was absent in 2 cases where infections remained uncontrolled by the end of follow-up. Our study illustrates the dynamic changes in virus-specific T cells that occur in children following liver transplantation, driven both by active viral replication and modulation of immunosuppression.

Keywords: T cell biology; clinical research/practice; infectious disease; liver transplantation/hepatology; monitoring: immune.


Conflict of interest statement

Disclosure

The authors of this manuscript have no conflicts of interest to disclose as described by the American Journal of Transplantation.

Figures

Figure 1
Figure 1. Circulating frequency of virus-specific T cells in study patients and healthy controls
The frequency of AdV, CMV, EBV, BKV and HHV6-specific T cells in peripheral blood of 25 children with end-stage liver disease (Panel a) and 19 age-matched healthy controls (Panel b) was determined by IFNγ ELISpot assay. Results are reported as spot forming cells (SFC) per 5×10E5 PBMCs.
Figure 2
Figure 2. Viral immune reconstitution following transplantation
Panel a shows the Adv-specific T cell frequency from pre-transplant to month 6, in 6 of the 16 transplanted patients with baseline immunity to Adenovirus and no corresponding viral infection (n=6). Results are displayed as median SFC/5×10E5 PBMCs +/− interquartile range. Panel b shows the corresponding changes in immunosuppression intensity - mean oral prednisone dose (mg/kg) is indicated by grey shading and mean ± SEM tacrolimus trough level (ng/ml) is depicted by a solid black line. Likewise Panel c shows the median (+/− interquartile range) CMV-specific T cell frequency from pre-transplant to month 6, in 4 transplanted patients who had baseline immunity to CMV and no corresponding viral infection. Panel d shows the corresponding immunosuppression intensity changes of the patients represented in Panel c.
Figure 3
Figure 3. Viral load and T cell profile of patients with primary CMV infection
Viral loads (IU/ml - dashed line) and CMV (IE1 and pp65)-specific T cell frequency (solid black bars) and antiviral use (light grey bar indicating prophylaxis and dark grey bar indicating treatment dose) with ganciclovir (GCV) or valganciclovir (VGCV) are shown for patients 3 (Panel a), 12 (Panel b) and 22 (Panel c), all of whom experienced a primary CMV infection post-transplant.
Figure 4
Figure 4. Viral load and T cell profile of patients with primary EBV and HHV6 infection
Viral loads (copies/μg DNA - dashed line) and EBV (EBNA1, LMP2, BZLF, LMP1, EBNA3a, 3b and 3c)-specific T cell frequency (solid black bars) are shown for patients 15 (Panel a), 3 (Panel b) and 19 (Panel c) and 18 (panel d), all of whom had primary EBV infection post-transplant. Panel e represents a single study patient who had a primary HHV6 infection and was treated with GCV (light grey bar indicating prophylaxis and dark grey bar showing treatment dose). Frequency of virus-specific T cells were measured by IFNγ ELISpot after overnight stimulation of PBMCs with HHV6 pepmixes (U11, U14, U90).
Figure 5
Figure 5. Viral load and T cell profile of patients with CMV reactivation
Viral loads (IU/ml – dashed line) and CMV (IE1 and pp65)-specific T cell frequency (solid black bars) and antiviral use (light grey bar indicating prophylaxis and dark grey indicating treatment dose) with ganciclovir (GCV) or valganciclovir (VGCV) are shown for patients 1 (Panel a) and 23 (Panel b) who experienced CMV reactivation.
Figure 6
Figure 6. Viral load and T cell profile of patients with EBV reactivation and secondary AdV exposure
Viral loads (copies/μg DNA - dashed line) and EBV (EBNA1, LMP2, BZLF, LMP1, EBNA3a, 3b and 3c)-specific T cell frequency (solid black bars) are shown for patients 1 (Panel a), 10 (Panel b) and 22 (Panel c), all of whom experienced EBV reactivation. Panel d represents a single study patient 19 who had Adenovirus infection. Frequency of virus-specific T cells were measured by IFNγ ELISpot after overnight stimulation of PBMCs with AdV pepmixes (Hexon and Penton)

References

    1. Toledo-Pereyra LH, Toledo AH. J Invest Surg. 2005;18(6):285–90. 1954. - PubMed
    1. Rana A, Gruessner A, Agopian VG, Khalpey Z, Riaz IB, Kaplan B, et al. Survival benefit of solid-organ transplant in the United States. JAMA Surg. 2015;150(3):252–9. - PubMed
    1. Gonwa TA. Transplantation. Am J Kidney Dis. 2000;35(4 Suppl 1):S153–9. - PubMed
    1. Lodhi SA, Lamb KE, Meier-Kriesche HU. Solid organ allograft survival improvement in the United States: the long-term does not mirror the dramatic short-term success. American journal of transplantation : official journal of the American Society of Transplantation and the American Society of Transplant Surgeons. 2011;11(6):1226–35. - PubMed
    1. LaRosa C, Baluarte HJ, Meyers KE. Outcomes in pediatric solid-organ transplantation. Pediatric transplantation. 2011;15(2):128–41. - PubMed

Publication types

MeSH terms

Substances