. 2018 May 25:3:63-85.
doi: 10.1016/j.isci.2018.04.007.

Apical Cell-Cell Adhesions Reconcile Symmetry and Asymmetry in Zebrafish Neurulation

Affiliations

Apical Cell-Cell Adhesions Reconcile Symmetry and Asymmetry in Zebrafish Neurulation

Chuanyu Guo et al. iScience. .

Abstract

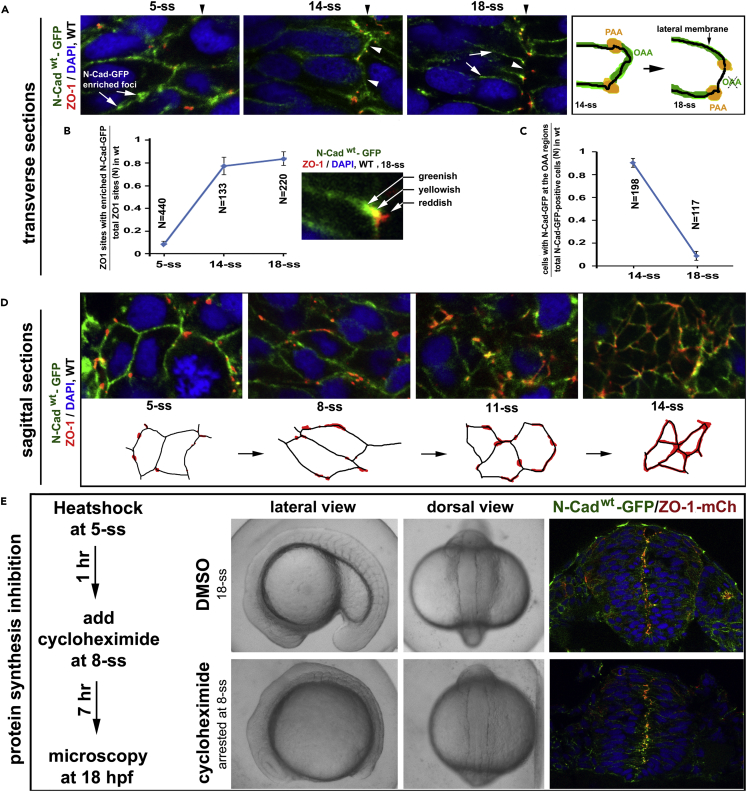
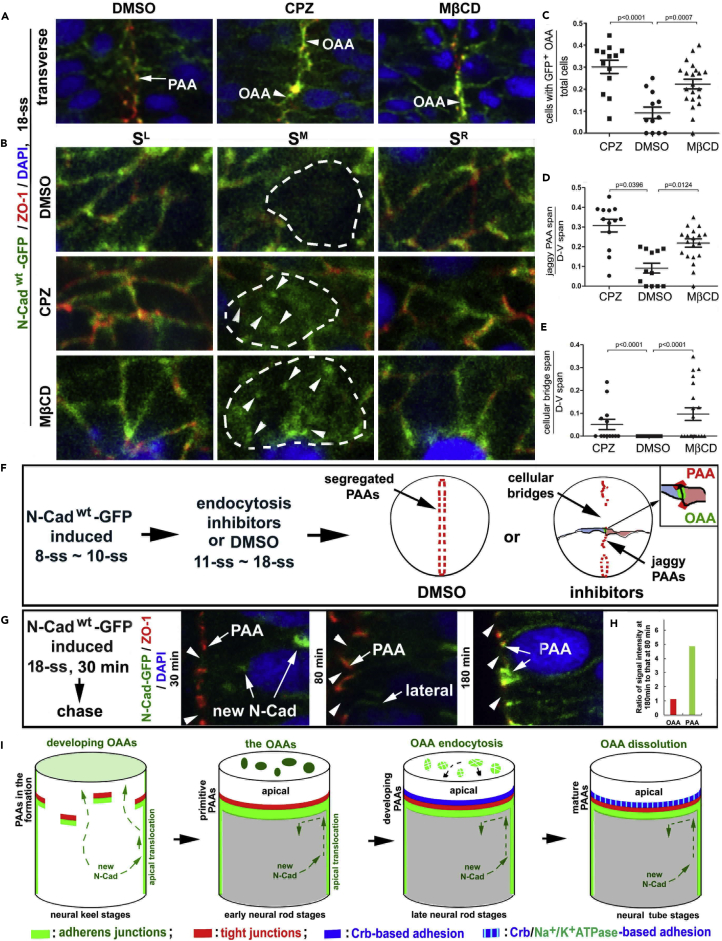
The symmetric tissue and body plans of animals are paradoxically constructed with asymmetric cells. To understand how the yin-yang duality of symmetry and asymmetry are reconciled, we asked whether apical polarity proteins orchestrate the development of the mirror-symmetric zebrafish neural tube by hierarchically modulating apical cell-cell adhesions. We found that apical polarity proteins localize by a pioneer-intermediate-terminal order. Pioneer proteins establish the mirror symmetry of the neural rod by initiating two distinct types of apical adhesions: the parallel apical adhesions (PAAs) cohere cells of parallel orientation and the novel opposing apical adhesions (OAAs) cohere cells of opposing orientation. Subsequently, the intermediate proteins selectively augment the PAAs when the OAAs dissolve by endocytosis. Finally, terminal proteins are required to inflate the neural tube by generating osmotic pressure. Our findings suggest a general mechanism to construct mirror-symmetric tissues: tissue symmetry can be established by organizing asymmetric cells opposingly via adhesions.


Conflict of interest statement

DECLARATION OF INTERESTS The authors declare no competing interests.

Figures

None
Graphical abstract
Figure 1
Figure 1
Three-Step Localizations of Apical Polarity Proteins Correlate with the Dynamics of Apical Cell-Cell Adhesions during Zebrafish Neurulation (A) Pioneer proteins N-Cad, visualized by immunohistochemistry, distributed ubiquitously on the cell membranes at 5-ss and then enriched apically (arrowheads) at 14-ss and 26-ss. Arrows, the otic vesicle. (B) Simultaneous staining of F-actin bundles, Nok, and Na+/K+ ATPase at 14-ss, 18-ss, and 26-ss. Note the lack of Nok signals in the neural tissue at 14-ss, except at the ventral end (arrowhead), and the lack of Na+/K+ ATPase apical enrichment at 14-ss and 18-ss. (C) The F-actin bundles and ZO-1 (in the gray areas in G) scattered in the neural keel (5-ss), aligned jaggedly in the early neural rod (14-ss), and aligned smoothly in the late neural rod (18-ss) and the neural tube (26-ss). (D–F and D′–F′) TEM revealed the dynamics of the PAAs and OAAs at the midline region during neurulation: no apparent electron-dense cell-cell junctional complexes in the neural keel at 5-ss (D and D′); apparent electron-dense PAAs (white arrows) and OAAs (white arrowheads) in the jaggy early neural rod at 14-ss (E and E′); and diminishing OAAs and persistent PAAs in the smooth late rod at 18-ss or the neural tube region where apical surfaces still juxtaposed at 26-ss (F and F′). D′–F′ are magnifications of the local regions boxed in D–F, respectively. The red arrows indicate the midline axis, which was defined as the dorsal-ventral central axis of the cross sections of the entire tissues under low magnifications. (G) Diagrams summarize the spatiotemporal localization order of pioneer, intermediate, and terminal proteins; the morphological changes of apical surface alignments; the dynamics of the PAAs and OAAs,; and the switch from cross-midline cell division mode (C-division) to parallel cell division mode (P-division) during the “neural keel-jaggy early neural rod-smooth late neural rod-neural tube” transition. Blue and magenta illustrate neuroepithelial cells of opposite orientations. Also see Figure S1.
Figure 2
Figure 2
Dynamics and Compositions of the PAAs and OAAs (A) Diagrams illustrate the principle of GFP-assisted sagittal serial microscopy for visualizing proteins at the opposing apical surfaces: the opposing apical surfaces at the midline region (SM), which contain the OAAs, must be flanked by two spatial references—PAA regions of the left and right halves of the tissue (SL and SR). Green represents transiently expressed GFP in some cells. The bottom panels are images collected with this technique: N-Cad and β-catenin were detected at the PAA regions as circumferential belts (SL and SR, arrows) as well as in the OAA regions as punctate foci (SM; arrowheads). By contrast, ZO-1 and actin were detected in the PAA regions (SL and SR, arrows) but not in the OAA regions (SM, arrowheads). (B) Diagrams illustrate the strategy to visualize transiently expressed N-Cadwt-GFP or N-Cadm117-GFP at 14-ss. Note that N-Cadwt-GFP enriched on the opposing apical surfaces (illustrated by the drawing on the right). (C) The PAAs (arrows) and the opposing apical surfaces (arrowheads indicating the OAAs) survived the Triton X-100 extraction of the anti-GFP immunogold electron microscopic procedure, whereas the lateral membranes were dissolved (basal of asterisks). (D) The magnification of the boxed region in C revealed the labeling of N-Cad-GFP with 5-nm gold particles at the PAAs (arrows, 72% of the PAAs were labeled with gold particles) and OAAs (arrowhead). Insets are magnifications of boxed regions. (E) Crb2a juxtaposed with ZO-1 sites at the apical ends (26-ss). (F) The table summarizes the developmental and compositional changes of the OAAs and PAAs. Crb*, Crb-based adhesion; NaKATPase*, Na+/K+-ATPase-based adhesion; +, presence; -, absence. Also see Figure S2.
Figure 3
Figure 3
Pioneer Proteins but not Intermediate Proteins Are Required to Establish the Mirror Symmetry of the Neural Tissue (A) In 26-ss N-Cadm117 mutants, apical marker ZO-1 and basal marker GFAP localized ectopically, and cells organized into cellular rosettes (circled by dashed lines), indicating the loss of the mirror symmetry. By contrast, the mirror symmetry remained in 26-ss nokm520, pard6fh266, and nok/pard6γb mutants, despite the presence of cellular bridges (arrows). Top panels, immunohistochemical images; bottom panels, drawings of the distributions of apical and basal markers. (B) ZO-1 did not align at the midline in N-Cadm117 mutants at 14-ss and 18-ss. (C) Drawings contrast the distributions of apical marker ZO-1 in N-Cadm117 mutants (blue) and wild-type embryos (red) at 14-ss and 18-ss. (D) Apical marker ZO-1 localized more frequently in the midline region in N-Cadm117 mutants that expressed N-Cadwt-GFP (in the Tg(HSP70:N-Cadwt-GFP)pt137 transgenic background) than in N-Cadm117 mutants that expressed N-Cadm117-GFP (in the Tg(HSP70:N-Cadm117-GFP)pt136 transgenic background). (E and F) To quantify the effects of rescuing expression of N-Cadwt-GFP (D) on midline distribution of ZO-1, we devised a symmetry index (E), where the midline region is defined as the midline-striding vertical strip of two nuclear diameters wide. (F) Statistical significance was evaluated by one-way ANOVA and Tukey's post hoc analysis. The individual-value bar graphs represent the symmetry indexes of rescued embryos (with means ± SEM). ANOVA, analysis of variance; SEM, standard error of the mean. (G–G″) In N-Cadm117 mutants at 14-ss, the PAA-like structures (red arrows, G″) were detectable under TEM, but no apparent adhesion structures could be identified on the opposing apical surfaces (green arrowheads, G′). G′ and G″ are magnifications of the boxed regions in (G). Also see Figure S3.
Figure 4
Figure 4
Pioneer Proteins Translocate Apically to Initiate the PAAs and OAAs (A) Dynamic distribution of N-Cadwt-GFP in Tg(HSP70:N-Cadwt-GFP)pt137: at 5-ss, ubiquitously on the cell membrane, with numerous N-Cadwt-GFP-enriched foci; at 14-ss, enriched at the PAAs and on opposing apical surfaces (arrowheads); at 18-ss, enriched at the PAAs and weakly present on the lateral membranes (white arrows), but absent on the opposing apical surfaces (arrowheads; drawings on the right). Black arrowheads indicate the positions of the midline axis. (B) A line graph displays the increase in the ratios between ZO-1 sites that were tightly associated with N-Cadwt-GFP-enriched foci and total ZO-1 sites from 5-ss to 18-ss (8 embryos for each stage; means ± SEM). The inset illustrates the tight association, but not 100% co-localization, between ZO-1 and N-Cadwt-GFP at the PAAs, resulting in greenish, yellowish, and reddish signal appearances. SEM, standard error of the mean. (C) A line graph displays the reduction in the ratios between cells with N-Cadwt-GFP on the opposing apical surfaces and total N-Cadwt-GFP-positive cells from 14-ss to 18-ss (8 embryos for each stage; mean ± SEM). (D) Sagittal imaging revealed that during neural keel-early neural rod transition, ZO-1 signals changed from small punctate sites to circumferential belts (illustrated by drawings). (E) The development of Tg(HSP70:N-Cadwt-GFP)pt137/Tg(HSP70: ZO-1.1-mCherry)pt117b double transgenic embryos was arrested at 8-ss (30 embryos) when treated with protein synthesis inhibitor cycloheximide, but the development proceeded normally to 18-ss (10 embryos) in the 4% DMSO control condition. The scheme illustrates the treatment procedure. In the presence of cycloheximide, N-Cadwt-GFP and ZO-1-mCherry (ZO-1-mCh) still localized to the midline region (compare with N-Cad-GFP and ZO-1 distributions in untreated embryos at 8-ss and 18-ss, Figure S4B). Also see Figure S4.
Figure 5
Figure 5
OAA Dissolution Depends on Endocytosis and Restriction of Apical Translocation of N-Cad (A) Effects of treatments with endocytosis inhibitors CPZ (N = 13 embryos) and MβCD (N = 20 embryos) on the apical adhesions in Tg(HSP70:N-Cadwt-GFP)pt137 embryos at 18-ss. Note that inhibition of endocytosis resulted in jaggy midline alignment of ZO-1 and accumulation of N-Cad-GFP at the opposing apical surface (arrowheads); however, in DMSO controls, the PAAs (arrows) segregated into two parallel planes flanking the midline and the OAAs dissolved. Panels are magnifications of the boxed regions in the bottom row of panels in Figure S5F. (B) Serial sagittal imaging of the apical adhesions revealed the retention of the N-Cad-GFP at the OAAs (arrowheads, SM sections) in embryos treated with either CPZ (N = 12 embryos) or MβCD (N = 12 embryos), but not in DMSO control (N = 4 embryos). The opposing apical surfaces are circled with dashed lines. (C–E) Individual-value bar graphs (with means ± SEM) illustrate the ratios between cells displaying N-Cadwt-GFP signals at the OAA region and total cells (C), the ratios between jaggy ZO-1 positive PAA span and dorsal-ventral (D-V) span (D), and the ratios between cellular bridge span and D-V span (E). The numbers of Type I and II embryos analyzed (Figures S5B and S5C) are 13 for CPZ, 20 for MβCD, and 12 for DMSO. p Values by two-tailed Student's t test. (F) A scheme summarizes the treatments and effects described in A–D. (G and H) N-Cadwt-GFP, when heat-shock-expressed for 30 min (starting at 18-ss), first appeared inside the cells 30 min later (arrows new N-Cad), then on the lateral cell membranes 80 min later (arrow lateral), and finally enriched at the PAAs (arrows PAA) 180 min later. Note that N-Cadwt-GFP never localized to the opposing apical surfaces (arrowheads) at any time. The changes of N-Cadwt-GFP signal intensities at the apical regions were quantified as ratios between 180-min chase (N of OAA sites = 59; N of PAA sites = 118) and 80-min chase (N of OAA sites = 45; N of PAA sites = 90); note no changes at the opposing apical surfaces and a five times increase at the PAAs (H). (I) Diagrams summarize the formation of primitive, developing, and mature PAAs, which block the apical translocation of newly synthesized N-Cad from the lateral membranes; the OAAs eventually dissolve by endocytosis. Also see Figure S5.
Figure 6
Figure 6
Intermediate Proteins Nok and Pard6 Stabilize the PAAs (A) Transverse imaging: In 26-ss nokm520 single and nokm520/pard6γbfh266 double mutants, ZO-1 and N-Cadwt-GFP aggregated in clusters (arrows) at the midline region, compared with the regular distribution of the PAAs in 26-ss wild-type. In 26-ss pard6γbfh266 mutants, the PAAs contoured small luminal sacs. (B) Sagittal imaging: As summarized by the drawings on the right, in 26-ss wild-type embryos, ZO-1 and N-Cadwt-GFP enriched at the PAAs as circumferential belts; by contrast, in 26-ss nokm520 mutants, ZO-1 and N-Cadwt-GFP clustered at the corners of the cells, indicating the loss of PAA integrity. (C) ZO-1 and N-Cadwt-GFP distributions (top panels, transverse imaging; bottom panels, sagittal imaging) in DMSO-treated and DNA-synthesis-inhibitor-treated wild-type and nokm520 mutants (6 wild-type and 12 mutant embryos for each condition). Note that inhibitor treatment of nokm520 mutants restored intact PAAs and miniature lumens (inset, arrow miniature lumens) and prevented cellular bridges (arrows cellular bridges). (D) TEM: Unlike in wild-type, where the PAAs sealed the paracellular clefts near the lumen (arrows), cell-cell junctional complexes clustered at membrane protrusions in nokm520 and indiscriminately adhered cells from both sides together at 26-ss (double arrowheads). Arrow BB, basal body. (E) A scheme depicts that Nok is required to maintain the PAAs during cell proliferation. Inhbt., DNA synthesis inhibitors. Also see Figure S6.
Figure 7
Figure 7
Terminal Protein Na+/K+-ATPase Is Required for Luminal Inflation but Not for OAA Dissolution (A) In 30-hpf nokm520 mutants, Na+/K+-ATPase α failed to enrich at the midline region in the neural tissue (arrowheads) but still enriched in the otic vesicle (arrows). (B) Brain ventricle inflation was blocked by ouabain treatment (arrows; 26-ss). (C) Ouabain did not prevent Na+/K+-ATPase α from enriching apically with Nok in the neural tissue (26-ss). (D and E) TEM revealed that in ouabain-treated embryos, the PAAs persisted (black arrows), whereas the OAAs were not detectable on the opposing apical cell membranes (arrowheads). (E) Magnification of the boxed region in (D). The red arrow indicates the midline direction. (F) Diagrams summarize that pioneer, intermediate, and terminal proteins regulate zebrafish neurulation through the three steps. (G) A diagram illustrates the three core elements that underlie symmetry formation: symmetry, asymmetry, and opposing configuration. Also see Figure S7.

Similar articles

Cited by

References

    1. Bagnat M., Cheung I.D., Mostov K.E., Stainier D.Y. Genetic control of single lumen formation in the zebrafish gut. Nat. Cell Biol. 2007;9:954–960. - PubMed
    1. Barald K.F., Kelley M.W. From placode to polarization: new tunes in inner ear development. Development. 2004;17:4119–4130. - PubMed
    1. Buckley C., Clarke J. Establishing the plane of symmetry for lumen formation and bilateral brain formation in the zebrafish neural rod. Semin. Cell Dev. Biol. 2014;31:100–105. - PubMed
    1. Buckley C.E., Ren X., Ward L.C., Girdler G.C., Araya C., Green M.J., Clark B.S., Link B.A., Clarke J.D. Mirror-symmetric microtubule assembly and cell interactions drive lumen formation in the zebrafish neural rod. EMBO J. 2013;32:30–44. - PMC - PubMed
    1. Cadwell C.M., Su W., Kowalczyk A.P. Cadherin tales: regulation of cadherin function by endocytic membrane trafficking. Traffic. 2016;17:1262–1271. - PubMed

LinkOut - more resources