

Inflammatory cytokine profile of co‑cultivated primary cells from the endometrium of women with and without endometriosis
- PMID: 29901132
- PMCID: PMC6072141
- DOI: 10.3892/mmr.2018.9137
Inflammatory cytokine profile of co‑cultivated primary cells from the endometrium of women with and without endometriosis
Abstract
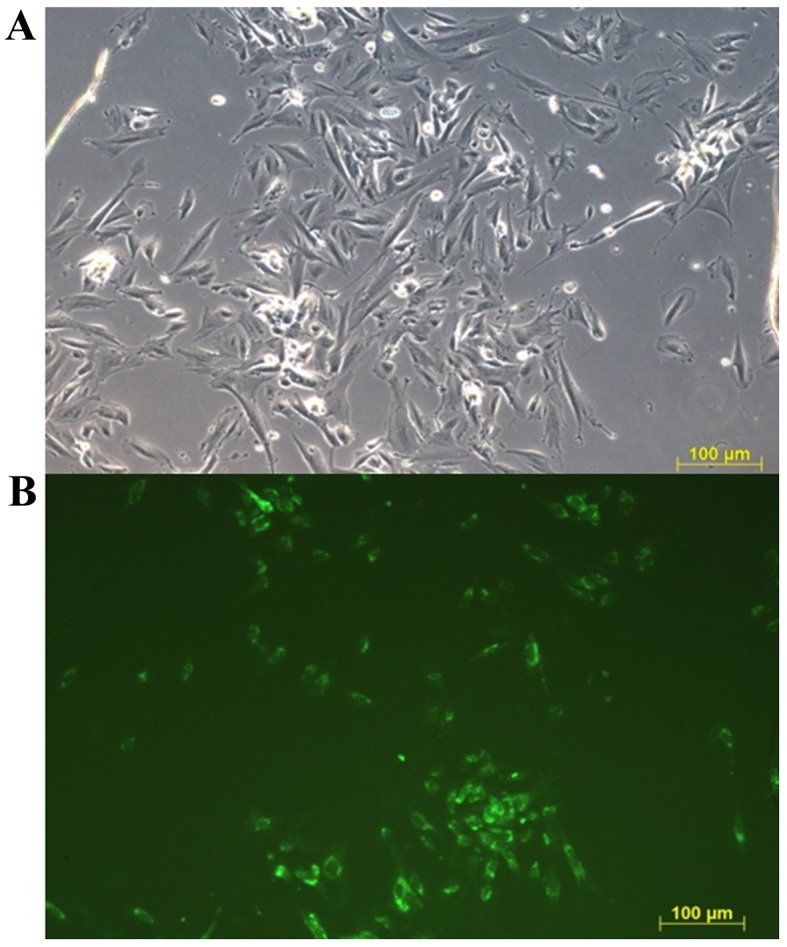
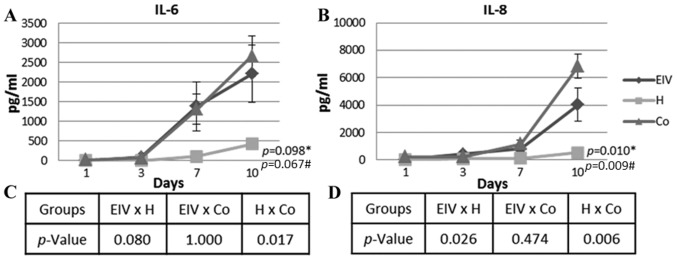
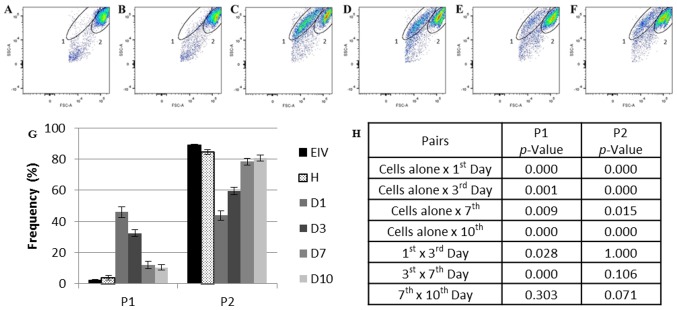
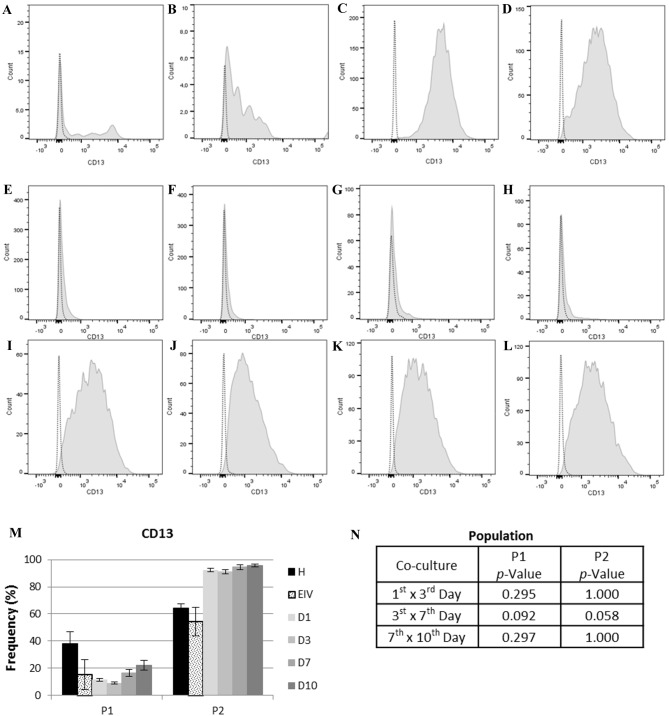
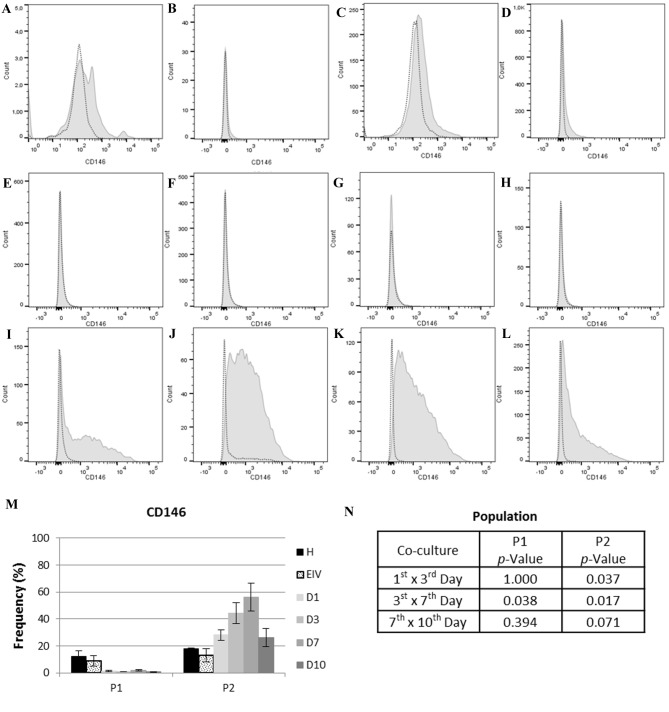
Endometriosis is a chronic gynecological disorder defined as the presence of endometrial tissue within extra-uterine sites. The primary symptoms are infertility and chronic pain. The inflammatory environment and aberrant immune responses in women with endometriosis may be directly associated with the initiation and progression of endometriotic lesions. In the present study, the secretion of inflammatory cytokines was evaluated in cultures of primary endometrial cells (ECs) isolated from the endometrium of women with and without endometriosis. The presence of endometriotic cells leads to alterations in the secretory profile of healthy ECs. The expression of the inflammatory cytokines interleukin (IL)‑6 and IL‑8 was significantly increased in endometriotic and co‑cultured cells compared with healthy ECs. IL‑6 expression was strongly correlated with IL‑8 expression in endometriotic cells. IL‑1β expression was increased on day 10 of co‑culture to 48.30 pg/ml and may be associated with the long‑term co‑culture, rather than IL‑6 and IL‑8 expression. IL‑6 expression was strongly correlated with cell number, whereas IL‑8 expression was moderately correlated with cell number. Additionally, it was observed that co‑cultured cells exhibited a different population of cells, with expression of the mesenchymal stem cell marker cell surface glycoprotein MUC18, indicating a putative role of endometrial mesenchymal stem cells in the secretion of cytokines and disease development. These results indicate a predominant role of primary endometriotic cells in the secretion of cytokines, which contributes to the disrupted peritoneal and endometrial environment observed in the women with endometriosis.
Figures
Similar articles
-
Urocortin 2 and urocortin 3 in endometriosis: evidence for a possible role in inflammatory response.Mol Hum Reprod. 2011 Sep;17(9):587-93. doi: 10.1093/molehr/gar020. Epub 2011 Mar 30. Mol Hum Reprod. 2011. PMID: 21454316
-
Persistent activation of signal transducer and activator of transcription 3 via interleukin-6 trans-signaling is involved in fibrosis of endometriosis.Hum Reprod. 2022 Jun 30;37(7):1489-1504. doi: 10.1093/humrep/deac098. Hum Reprod. 2022. PMID: 35551394
-
p27kip1 overexpression regulates IL-1β in the microenvironment of stem cells and eutopic endometriosis co-cultures.Cytokine. 2017 Jan;89:229-234. doi: 10.1016/j.cyto.2015.12.015. Epub 2016 Jan 23. Cytokine. 2017. PMID: 26817396
-
Local cytokines in endometrial tissue: the role of interleukin-8 in the pathogenesis of endometriosis.Ann N Y Acad Sci. 2002 Mar;955:101-9; discussion 118, 396-406. doi: 10.1111/j.1749-6632.2002.tb02770.x. Ann N Y Acad Sci. 2002. PMID: 11949939 Review.
-
Endometrial anomalies in women with endometriosis.Ann N Y Acad Sci. 2001 Sep;943:131-47. doi: 10.1111/j.1749-6632.2001.tb03797.x. Ann N Y Acad Sci. 2001. PMID: 11594534 Review.
Cited by
-
Serum concentrations of CCL20/MIP-3alpha in women with endometriosis.Prz Menopauzalny. 2019 Apr;18(1):9-14. doi: 10.5114/pm.2019.84151. Epub 2019 Apr 9. Prz Menopauzalny. 2019. PMID: 31114452 Free PMC article.
-
Inflammatory Mediators and Pain in Endometriosis: A Systematic Review.Biomedicines. 2021 Jan 8;9(1):54. doi: 10.3390/biomedicines9010054. Biomedicines. 2021. PMID: 33435569 Free PMC article. Review.
-
The landscape of non-coding RNAs in the immunopathogenesis of Endometriosis.Front Immunol. 2023 Aug 22;14:1223828. doi: 10.3389/fimmu.2023.1223828. eCollection 2023. Front Immunol. 2023. PMID: 37675122 Free PMC article. Review.
-
N-acetylcysteine stimulates organelle malfunction in endometriotic cells via IFN-gamma signaling.Sci Rep. 2025 Apr 29;15(1):15120. doi: 10.1038/s41598-025-00195-z. Sci Rep. 2025. PMID: 40301453 Free PMC article.
-
Single-cell analysis of menstrual endometrial tissues defines phenotypes associated with endometriosis.BMC Med. 2022 Sep 15;20(1):315. doi: 10.1186/s12916-022-02500-3. BMC Med. 2022. PMID: 36104692 Free PMC article.
References
MeSH terms
Substances
LinkOut - more resources
Full Text Sources
Other Literature Sources
Medical
