. 2018 Jun 27;69(15):3715-3728.
doi: 10.1093/jxb/ery171.

Exposure to heavy metal stress triggers changes in plasmodesmatal permeability via deposition and breakdown of callose

Affiliations

Exposure to heavy metal stress triggers changes in plasmodesmatal permeability via deposition and breakdown of callose

Ruthsabel O'Lexy et al. J Exp Bot. .

Abstract

Both plants and animals must contend with changes in their environment. The ability to respond appropriately to these changes often underlies the ability of the individual to survive. In plants, an early response to environmental stress is an alteration in plasmodesmatal permeability with accompanying changes in cell to cell signaling. However, the ways in which plasmodesmata are modified, the molecular players involved in this regulation, and the biological significance of these responses are not well understood. Here, we examine the effects of nutrient scarcity and excess on plasmodesmata-mediated transport in the Arabidopsis thaliana root and identify two CALLOSE SYNTHASES and two β-1,3-GLUCANASES as key regulators of these processes. Our results suggest that modification of plasmodesmata-mediated signaling underlies the ability of the plant to maintain root growth and properly partition nutrients when grown under conditions of excess nutrients.


Figures

Fig. 1.
Fig. 1.
Changes in movement of CF after nutrient stress. (A) Distance of CF transport (from the root tip shootwards) in roots grown for 24 h under the treatment conditions indicated in the figure. For this assay, CFDA was micropipetted to the root tip and then incubated at room temperature for 5 min prior to imaging. Distance of movement was then measured as described in the Materials and methods on modified images using ImageJ. Green boxes indicate an increase in movement; pink indicates a decrease. A significant difference relative to control images is also indicated by asterisks (Wilcoxon rank sum test; P<0.05, n>24). (B, B'). Representative images of CF after a color threshold has been applied using ImageJ under (B) control or (B') 600 µM Fe. The red arrows indicate the direction and approximate extent of CF movement.
Fig. 2.
Fig. 2.
Effect of nutrient stress on the movement of GFP from the phloem. (A–H) SUC2:GFP-expressing 6-day-old seedlings 24 h after transfer to (A) standard MS (control), (B) 600 µM iron, (C) 50 µM copper, (D) 150 µM zinc, (E) 85 µM cadmium, (F) 0 µM iron, (G) 0 µM phosphate, and (H) 0 µM zinc-containing media. Scale bar=75 µm. Inset values are the ratio of mean GFP mean fluorescence intensity in the stele of the root tip just above the QC (white boxed region) relative to the stele in the transition zone of the root where SUC2 is expressed (yellow boxed region); an asterisk indicates statistical significance (P<0.05) in a two-tailed t-test, n>10. (I) GFP signal intensity (reported as arbitrary fluorescence units; AFU) measured radially (as indicated by the yellow line) across the phloem strands (cells where SUC2 is expressed, yellow arrows) in the transition zone of the root. The graph shows one representative sample profile each from: control (gray), 50 µM copper- (green), and 600 µM iron- (red) treated roots. Additional images are provided in Supplementary Fig. S2.
Fig. 3.
Fig. 3.
Iron, copper, and phosphate stress alter the levels of callose. Aniline blue staining of callose 24 h after transfer to (A) standard (control) MS medium, (B) 600 µM iron, (C) 50 µM copper, (D) 150 µM zinc, (E) 85 µM cadmium, (F) 0 µM iron, (G) 0 µM phosphate, and (H) 0 µM zinc. Scale bar=100 µm. (I) Mean fluorescence intensity (MFI) of the aniline blue signal was calculated in ImageJ (an unstained root is shown in Supplementary Fig. S3D to demonstrate the lack of autofluorescence). An asterisk under boxes indicates a significant difference (asterisks indicate P<0.05; Wilcoxon rank sum test, n>19) in fluorescent intensity relative to the control. In (F) and (H) images were squared off after cropping using black fill with a dotted white outline to show modification to the original image.
Fig. 4.
Fig. 4.
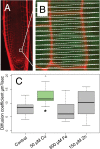
Treatment of roots with 50 µM copper increases the coefficient of diffusion of GFP in the root meristem. (A) The small white box in the propidium iodide (PI)-stained root shows a representative region of interest (ROI) used for RICS. This region is shown in (B) as a magnified image. For these assays, 5-day-old roots expressing the 35S:GFP construct were transferred for 24 h to media containing excess copper, iron, or zinc prior to imaging. (C) Average diffusion coefficients for free GFP in roots after 24 h of treatment with 50 µM copper, 600 µM iron, or 150 µM zinc are shown in the box plots. An asterisk indicates a significant (P<0.05, Wilcoxon rank sum test, n>14) difference in movement from control roots. The circle outside the box is an outlier.
Fig. 5.
Fig. 5.
cals5 and cals12 seedlings have altered responses to excess iron. (A–D) Aniline blue staining of callose in (A and A') the wild type, (B and B') cals5-2, and (C and C') cals12-1 under (A–C) control conditions, and (A'–C') 24 h after treatment with 600 µM Fe. (D) Quantification of callose levels in cals5-2 and cals12-1 roots after 24 h of growth on control medium or medium containing 600 μM Fe. Asterisks indicate P<0.05, two-tailed t-test, n>19. (E–G') Treatment of cals5 and cals12 seedlings with 600 µM Fe has no effect on the movement of GFP. GFP localization in 6-day-old wild-type, cals5, and cals12 seedlings expressing SUC2:GFP 24 h after transfer to (E–G) standard MS (control) medium or (E'–G') medium containing 600 µM iron. QC:P ratios (as shown in Fig. 2) for (F( and (F') are 0.49 and 0.51, respectively, and 0.63 and 0.64 for (G) and (G'), respectively. Scale bars in A–G'=100 µm.
Fig. 6.
Fig. 6.
Mutations in the β-1,3-glucanases, BG_PPAP or BG6, impair the roots’ response to copper. Aniline blue staining of roots from the wild type and β-1,3-glucanase mutants (genotypes indicated) (A–C) prior to and (A'–C') 24 h after transfer to control MS medium or medium containing 50 µM Cu. Scale bar=100 µm. (D) Quantification of callose levels in the wild type, bg_ppap-1, and bg6-1 before and 24 h after 50 μM Cu treatment. Asterisks indicate a significant difference (P<0.05, comparisons indicated; two-tailed t-test, n>19). (E) CFDA transport in bg_ppap-1 and bg6-1 roots is not affected by excess copper; asterisks indicate a significant difference (P<0.05; Wilcoxon rank sum test, n>24).
Fig. 7.
Fig. 7.
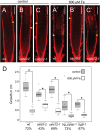
cals5 mutants are less sensitive to the growth-inhibiting effect of 600 µM iron than the wild type. (A–C) Five-day-old roots (genotypes indicated) were transferred for 3 d to (A–C) regular MS medium or (A'–C') medium containing 600 µM iron and then stained with propidium iodide (PI) to visualize the cell walls. Scale bar=100 µm. The yellow arrowheads indicate the end of the meristematic zone and the beginning of the elongation zone. (D) Mean increase in the length of the primary root during the 3 d period post-transfer to control medium or medium containing of 600 µM iron. Percentages below the root genotypes indicate the percentage inhibition of growth relative to control roots transferred to MS medium. Two-tailed t-test; asterisks indicate P<0.05, n>14; error bars indicate the SE. Blue stars indicate that growth is statistically different from the wild type under control conditions.
Fig. 8.
Fig. 8.
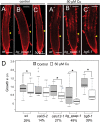
β-1,3-Glucanase mutants are more sensitive to the growth-inhibiting effect of 50 μM copper than the wild-type. (A–C) Five-day-old roots (genotypes indicated) were transferred for 3 d to (A–C) regular MS medium or (A'–C') medium containing 50 μM Cu and then stained with propidium iodide to visualize the cell walls. Scale bar = 100 μm. (D) Increase in the length of the primary root during the 3 d post-transfer to control or medium containing of 50 μM copper. Percentages below the root genotypes indicate the percentage inhibition of growth relative to MS-grown roots. Two-tailed t-test; asterisks indicate P < 0.05, n > 14; error bars indicate the SE. Blue stars on bars indicate that growth is statistically different (P < 0.05; two-tailed t-test) from the wild type under control conditions.
Fig. 9.
Fig. 9.
β-1,3-Glucanase mutants accumulate excess copper in the root tip. Accumulative signal intensity of copper in arbitrary units (AU) in the wild type, bg_ppap, and bg6 after 24 h of 50 µM Cu; n=3 for each group. The x-axis corresponds to the location of the sample taken along the root, with punch 1 being at the meristem and moving shootwards.

Similar articles

Cited by

References

    1. Anderson MA. 1991. Long-term effects of copper rich swine manure application on continuous corn production. Communications in Soil Science and Plant Analysis 22, 993–1002.
    1. Angell SM, Davies C, Baulcombe DC. 1996. Cell-to-cell movement of potato virus X is associated with a change in the size-exclusion limit of plasmodesmata in trichome cells of Nicotiana clevelandii. Virology 216, 197–201. - PubMed
    1. Arias M, López E, Fernández D, Soto B. 2004. Copper distribution and dynamics in acid vineyard soils treated with copper-based fungicides. Soil Science 169, 796–805.
    1. Bates TE. 1971. Factors affecting critical nutrient concentrations in plants and their evaluation: a review. Soil Science 112, 116–130.
    1. Benitez-Alfonso Y, Cilia M, San Roman A, Thomas C, Maule A, Hearn S, Jackson D. 2009. Control of Arabidopsis meristem development by thioredoxin-dependent regulation of intercellular transport. Proceedings of the National Academy of Sciences, USA 106, 3615–3620. - PMC - PubMed

Publication types

MeSH terms