

Chronic stress dampens excitatory synaptic gain in the paraventricular nucleus of the hypothalamus
- PMID: 29901836
- PMCID: PMC6117590
- DOI: 10.1113/JP275669
Chronic stress dampens excitatory synaptic gain in the paraventricular nucleus of the hypothalamus
Abstract
Key points: Glutamatergic synaptic inputs to corticotrophin-releasing hormone (CRH) secreting neurons in the paraventricular nucleus of the hypothalamus (PVN) are required for stress-induced activation of the hypothalamic-pituitary-adrenal (HPA) axis. These synapses also undergo stress-induced plasticity, thereby influencing HPA axis stress adaptation. By using patch clamp electrophysiology, we show that, in adult non-stressed mice, action potentials at these glutamatergic afferents elicit multiquantal transmission to the postsynaptic PVN-CRH neurons (i.e. synaptic multiplicity). Mechanistically, synaptic multiplicity results from multivesicular release at common synaptic sites, which is facilitated upon elevation of release probability, effectively increasing the upper limit of the dynamic range of synaptic transmission. Following chronic variable stress, functional PVN glutamate synapse number increases, although its synaptic multiplicity paradoxically decreases. These two contrasting synaptic changes can, respectively, increase the baseline excitatory drive while also limiting the capacity for potentiation, and may preferentially increase the baseline excitatory drive onto PVN-CRH neurons.
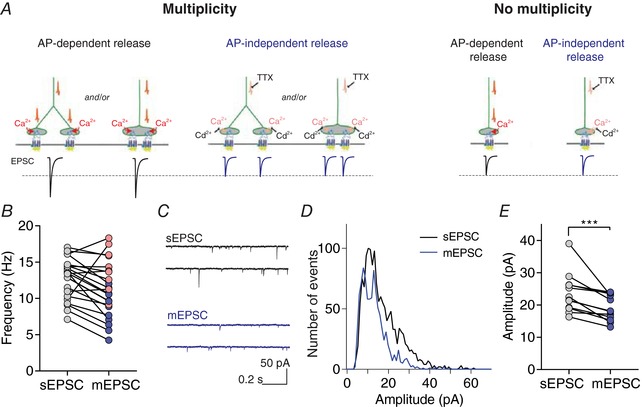
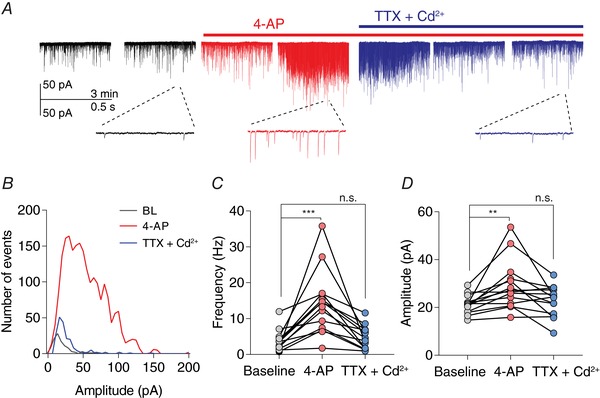
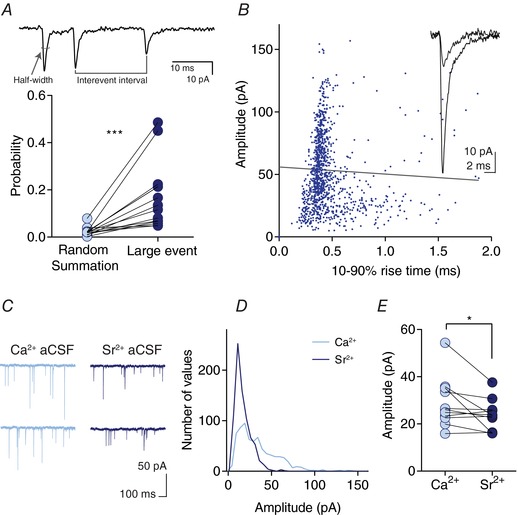
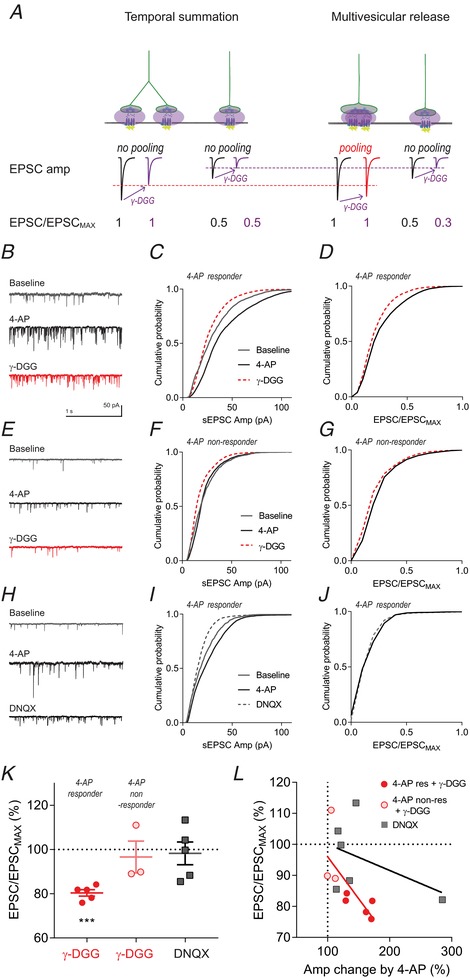
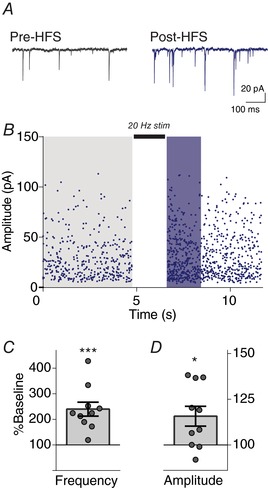
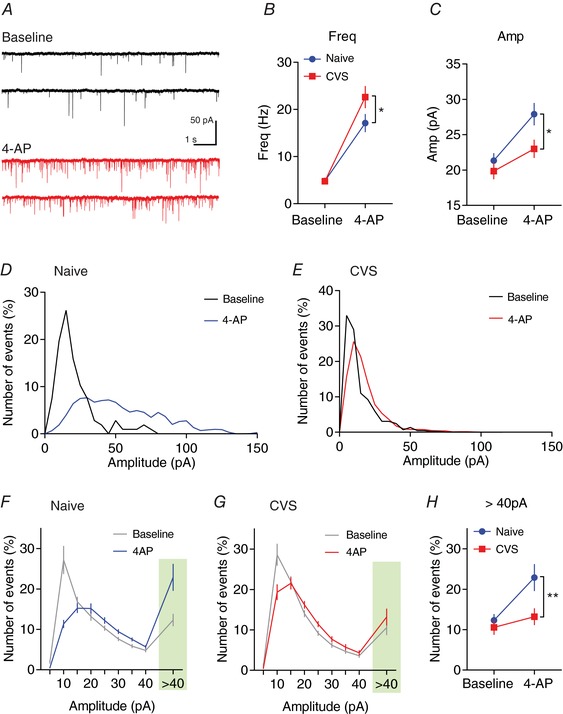
Abstract: The activation of the hypothalamic-pituitary-adrenal (HPA) axis relies on excitation of neuroendocrine neurons in the paraventricular nucleus of the hypothalamus (PVN) that secrete corticotrophin-releasing hormone (CRH). Afferent glutamate synapses onto these PVN-CRH neurons convey critical excitatory inputs during stress, and also undergo stress-induced plasticity, highlighting their roles in both stress activation and adaptation of the HPA axis. In the present study, using whole-cell patch clamp recordings from PVN-CRH neurons in brain slices from adult mice, we found that the amplitude of action potential-dependent spontaneous EPSCs (sEPSCs) was larger than that of action potential independent miniature EPSCs (mEPSCs), suggesting that action potentials at individual axons recruited multiquantal transmission onto the same postsynaptic neurons (i.e. synaptic multiplicity). The large, putative multiquantal sEPSCs had fast rise times similar to mEPSCs, and were abolished by replacing extracellular Ca2+ with Sr2+ , indicating Ca2+ -dependent synchronous release of multiple vesicles. Application of a low affinity, fast dissociating competitive AMPA receptor antagonist γ-d-glutamylglycine revealed that synaptic multiplicity resulted from multivesicular release targeting a common population of postsynaptic receptors. High-frequency afferent stimulation facilitated synaptic multiplicity, effectively increasing the upper limit of the dynamic range of synaptic transmission. Finally, we found that chronic variable stress (CVS), a stress model known to cause basal HPA axis hyperactivity, increased sEPSCs frequency but paradoxically decreased synaptic multiplicity. These results suggest that the CVS-induced synaptic changes may elevate the baseline excitatory drive at the same time as limiting the capacity for potentiation, and may contribute to the basal HPA axis hyperactivity.
Keywords: Neuroendocrine; patch clamp electrophysiology; synaptic plasticity.
© 2018 The Authors. The Journal of Physiology © 2018 The Physiological Society.
Figures
Similar articles
-
Enhanced Hypothalamic NMDA Receptor Activity Contributes to Hyperactivity of HPA Axis in Chronic Stress in Male Rats.Endocrinology. 2018 Mar 1;159(3):1537-1546. doi: 10.1210/en.2017-03176. Endocrinology. 2018. PMID: 29390057 Free PMC article.
-
Nicotine excites corticotropin-releasing hormone mRNA-expressing neuron in the hypothalamic paraventricular nucleus in vitro in rats.Neuroreport. 2016 May 25;27(8):580-6. doi: 10.1097/WNR.0000000000000573. Neuroreport. 2016. PMID: 27022819
-
Relaxin-3/RXFP3 signalling in mouse hypothalamus: no effect of RXFP3 activation on corticosterone, despite reduced presynaptic excitatory input onto paraventricular CRH neurons in vitro.Psychopharmacology (Berl). 2017 Jun;234(11):1725-1739. doi: 10.1007/s00213-017-4575-z. Epub 2017 Mar 17. Psychopharmacology (Berl). 2017. PMID: 28314951
-
Heterosynaptic modulation in the paraventricular nucleus of the hypothalamus.Neuropharmacology. 2019 Aug;154:87-95. doi: 10.1016/j.neuropharm.2018.11.004. Epub 2018 Nov 5. Neuropharmacology. 2019. PMID: 30408488 Review.
-
Hypothalamic corticotrophin releasing hormone neurons in stress-induced psychopathology: Revaluation of synaptic contributions.J Neuroendocrinol. 2023 Apr;35(4):e13268. doi: 10.1111/jne.13268. Epub 2023 Apr 20. J Neuroendocrinol. 2023. PMID: 37078436 Review.
Cited by
-
Norepinephrine triggers glutamatergic long-term potentiation in hypothalamic paraventricular nucleus magnocellular neuroendocrine cells through postsynaptic β1-AR/PKA signaling pathway in vitro in rats.Korean J Physiol Pharmacol. 2024 Nov 1;28(6):569-576. doi: 10.4196/kjpp.2024.28.6.569. Korean J Physiol Pharmacol. 2024. PMID: 39467720 Free PMC article.
-
Morphohistochemical alterations of neurons of the supraoptic nucleus of the rat hypothalamus at different durations of the photoperiod and melatonin administration.J Med Life. 2021 Nov-Dec;14(6):810-815. doi: 10.25122/jml-2021-0220. J Med Life. 2021. PMID: 35126752 Free PMC article.
-
A Nitric Oxide-Dependent Presynaptic LTP at Glutamatergic Synapses of the PVN Magnocellular Neurosecretory Cells in vitro in Rats.Front Cell Neurosci. 2019 Jun 27;13:283. doi: 10.3389/fncel.2019.00283. eCollection 2019. Front Cell Neurosci. 2019. PMID: 31316353 Free PMC article.
-
Contribution of DNA methylation in chronic stress-induced cardiac remodeling and arrhythmias in mice.FASEB J. 2019 Nov;33(11):12240-12252. doi: 10.1096/fj.201900100R. Epub 2019 Aug 30. FASEB J. 2019. PMID: 31431066 Free PMC article.
-
Physical restraint mouse models to assess immune responses under stress with or without habituation.STAR Protoc. 2021 Sep 14;2(4):100838. doi: 10.1016/j.xpro.2021.100838. eCollection 2021 Dec 17. STAR Protoc. 2021. PMID: 34568850 Free PMC article.
References
-
- Bains JS, Cusulin JIW & Inoue W (2015). Stress‐related synaptic plasticity in the hypothalamus. Nat Rev Neurosci 16, 377–388. - PubMed
-
- Bartanusz V, Muller D, Gaillard RC, Streit P, Vutskits L & Kiss JZ (2004). Local gamma‐aminobutyric acid and glutamate circuit control of hypophyseotrophic corticotropin‐releasing factor neuron activity in the paraventricular nucleus of the hypothalamus. Eur J Neurosci 19, 777–782. - PubMed
Publication types
MeSH terms
Substances
LinkOut - more resources
Full Text Sources
Other Literature Sources
Medical
Research Materials
Miscellaneous