

An observational study of ballooning in large spiders: Nanoscale multifibers enable large spiders' soaring flight
- PMID: 29902191
- PMCID: PMC6001951
- DOI: 10.1371/journal.pbio.2004405
An observational study of ballooning in large spiders: Nanoscale multifibers enable large spiders' soaring flight
Abstract
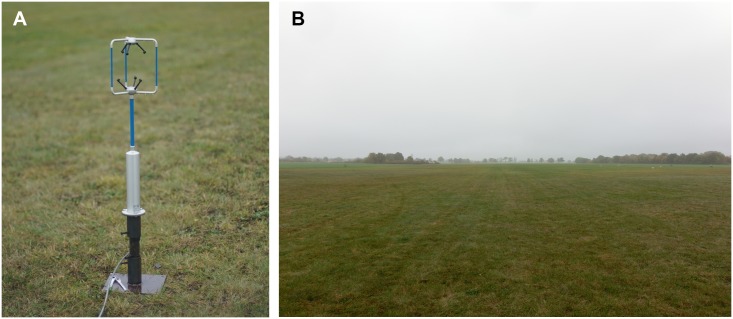
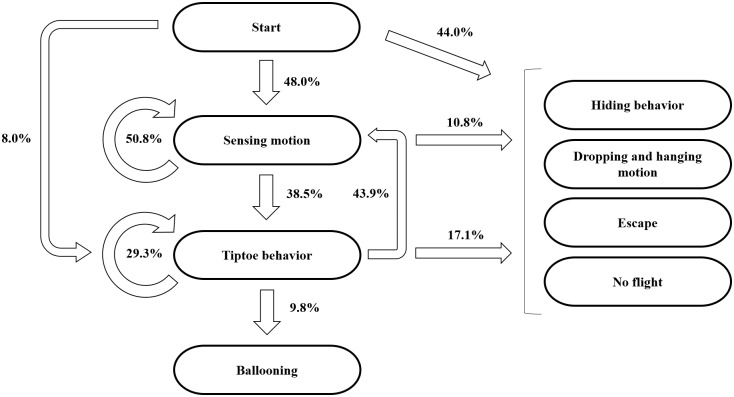
The physical mechanism of aerial dispersal of spiders, "ballooning behavior," is still unclear because of the lack of serious scientific observations and experiments. Therefore, as a first step in clarifying the phenomenon, we studied the ballooning behavior of relatively large spiders (heavier than 5 mg) in nature. Additional wind tunnel tests to identify ballooning silks were implemented in the laboratory. From our observation, it seems obvious that spiders actively evaluate the condition of the wind with their front leg (leg I) and wait for the preferable wind condition for their ballooning takeoff. In the wind tunnel tests, as-yet-unknown physical properties of ballooning fibers (length, thickness, and number of fibers) were identified. Large spiders, 16-20 mg Xysticus spp., spun 50-60 nanoscale fibers, with a diameter of 121-323 nm. The length of these threads was 3.22 ± 1.31 m (N = 22). These physical properties of ballooning fibers can explain the ballooning of large spiders with relatively light updrafts, 0.1-0.5 m s-1, which exist in a light breeze of 1.5-3.3 m s-1. Additionally, in line with previous research on turbulence in atmospheric boundary layers and from our wind measurements, it is hypothesized that spiders use the ascending air current for their aerial dispersal, the "ejection" regime, which is induced by hairpin vortices in the atmospheric boundary layer turbulence. This regime is highly correlated with lower wind speeds. This coincides well with the fact that spiders usually balloon when the wind speed is lower than 3 m s-1.
Conflict of interest statement
The authors have declared that no competing interests exist.
Figures


Similar articles
-
Aerodynamics and the role of the earth's electric field in the spiders' ballooning flight.J Comp Physiol A Neuroethol Sens Neural Behav Physiol. 2021 Mar;207(2):219-236. doi: 10.1007/s00359-021-01474-6. Epub 2021 Mar 13. J Comp Physiol A Neuroethol Sens Neural Behav Physiol. 2021. PMID: 33712884 Review.
-
The Importance of a Filament-like Structure in Aerial Dispersal and the Rarefaction Effect of Air Molecules on a Nanoscale Fiber: Detailed Physics in Spiders' Ballooning.Integr Comp Biol. 2020 Oct 1;60(4):864-875. doi: 10.1093/icb/icaa063. Integr Comp Biol. 2020. PMID: 32516363
-
Phenological and meteorological determinants of spider ballooning in an agricultural landscape.C R Biol. 2016 Sep-Oct;339(9-10):408-16. doi: 10.1016/j.crvi.2016.06.007. Epub 2016 Aug 12. C R Biol. 2016. PMID: 27527898
-
Low propensity for aerial dispersal in specialist spiders from fragmented landscapes.Proc Biol Sci. 2003 Aug 7;270(1524):1601-7. doi: 10.1098/rspb.2003.2432. Proc Biol Sci. 2003. PMID: 12908981 Free PMC article.
-
Ballooning dispersal using silk: world fauna, phylogenies, genetics and models.Bull Entomol Res. 2005 Apr;95(2):69-114. doi: 10.1079/ber2004350. Bull Entomol Res. 2005. PMID: 15877859 Review.
Cited by
-
Aerodynamics and the role of the earth's electric field in the spiders' ballooning flight.J Comp Physiol A Neuroethol Sens Neural Behav Physiol. 2021 Mar;207(2):219-236. doi: 10.1007/s00359-021-01474-6. Epub 2021 Mar 13. J Comp Physiol A Neuroethol Sens Neural Behav Physiol. 2021. PMID: 33712884 Review.
-
High genetic diversity of spider species in a mosaic montane grassland landscape.PLoS One. 2020 Jun 8;15(6):e0234437. doi: 10.1371/journal.pone.0234437. eCollection 2020. PLoS One. 2020. PMID: 32511281 Free PMC article.
-
Sex differences in spiders: from phenotype to genomics.Dev Genes Evol. 2020 Mar;230(2):155-172. doi: 10.1007/s00427-020-00657-6. Epub 2020 Feb 12. Dev Genes Evol. 2020. PMID: 32052129 Free PMC article. Review.
-
Relevance of ddRADseq method for species and population delimitation of closely related and widely distributed wolf spiders (Araneae, Lycosidae).Sci Rep. 2021 Jan 26;11(1):2177. doi: 10.1038/s41598-021-81788-2. Sci Rep. 2021. PMID: 33500478 Free PMC article.
-
Dispersal and life-history traits in a spider with rapid range expansion.Mov Ecol. 2020 Jan 7;8:2. doi: 10.1186/s40462-019-0182-4. eCollection 2020. Mov Ecol. 2020. PMID: 31921424 Free PMC article.
References
-
- Richter CJJ. Aerial dispersal in relation to habitat in eight wolf spider species (Pardosa, Araneae, Lycosidae). Oecologia 1970;5(3):200–14. doi: 10.1007/BF00344884 - DOI - PubMed
-
- Salmon JT, Horner NV. Aerial dispersion of spiders in North Central Texas. The J. Arachnol. 1977;5(2):153–7.
-
- Tolbert WW. Aerial dispersal behavior of two orb weaving spiders. Psyche: A Journal of Entomology 1977;84(1):13–27.
-
- Dean D.A, Sterling WL. Size and phenology of ballooning spiders at two locations in eastern Texas. J. Arachnol. 1985;(13):111–20.
-
- Greenstone MH, Morgan CE, Hultsch AL, Farrow RA, Dowse JE. Ballooning spiders in Missouri, USA, and New South Wales, Australia: Family and mass distributions. J. Arachnol. 1987;15(2):163–70.
Publication types
MeSH terms
Substances
LinkOut - more resources
Full Text Sources
Other Literature Sources
Miscellaneous
