

A comparison of standard and compositional data analysis in studies addressing group differences in sedentary behavior and physical activity
- PMID: 29903009
- PMCID: PMC6003121
- DOI: 10.1186/s12966-018-0685-1
A comparison of standard and compositional data analysis in studies addressing group differences in sedentary behavior and physical activity
Abstract
Background: Data on time spent in physical activity, sedentary behavior and sleep during a day is compositional in nature, i.e. they add up to a constant value. Compositional data have fundamentally different properties from unconstrained data in real space, and require other analytical procedures, referred to as compositional data analysis (CoDA). Most physical activity and sedentary behavior studies, however, still apply analytical procedures adapted to data in real space, which can lead to misleading results. The present study describes a comparison of time spent sedentary and in physical activity between age groups and sexes, and investigates the extent to which results obtained by CoDA differ from those obtained using standard analytical procedures.
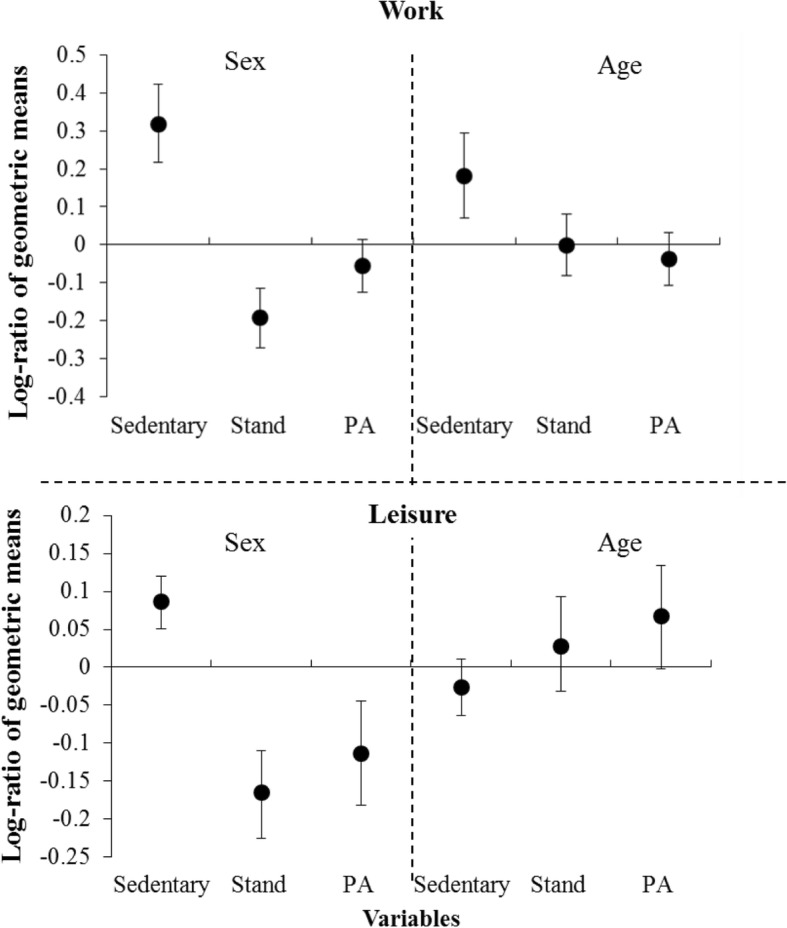
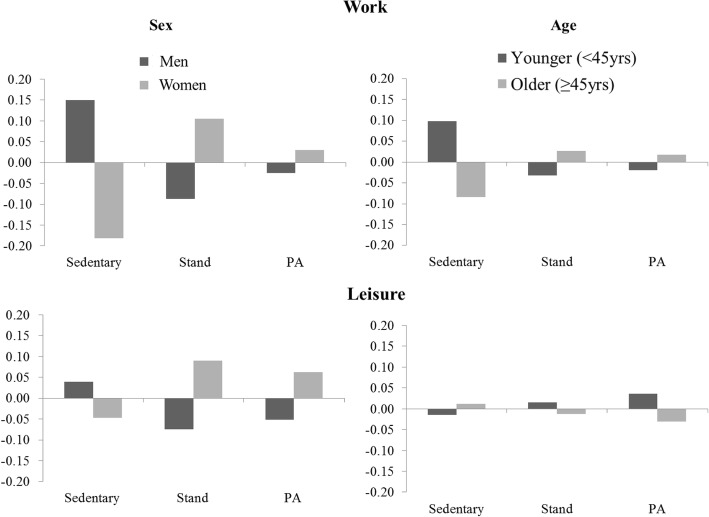
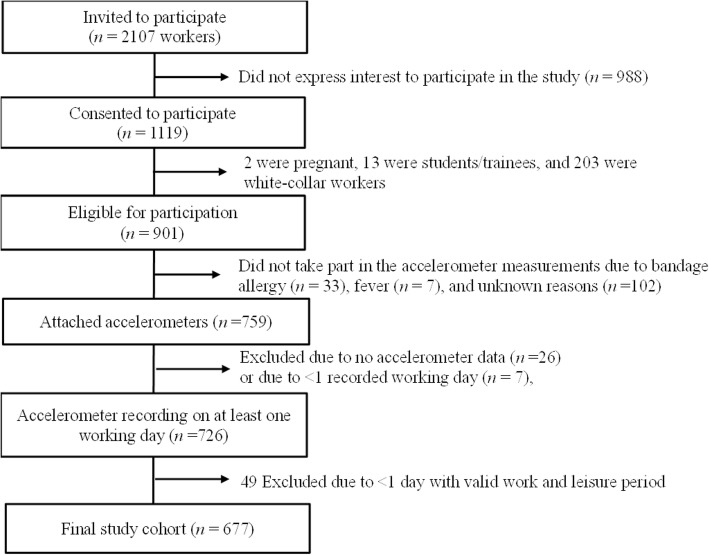
Methods: Time spent sedentary, standing, and in physical activity (walking/running/stair climbing/cycling) during work and leisure was determined for 1-4 days among 677 blue-collar workers using accelerometry. Differences between sexes and age groups were tested using MANOVA, using both a standard and a CoDA approach based on isometric log-ratio transformed data.
Results: When determining differences between sexes for different activities time at work, the effect size using standard analysis (η2 = 0.045, p < 0.001) was 15% smaller than that obtained with CoDA (η2 = 0.052, p < 0.001), although both approaches suggested a statistically significant difference. When determining corresponding differences between age groups, CoDA resulted in a 60% larger, and significant, effect size (η2 = 0.012, p = 0.02) than that obtained with the standard approach (η2 = 0.008, p = 0.07). During leisure, results based on standard (age; η2 = 0.007, p = 0.09; sex; η2 = 0.052, p < 0.001) and CoDA (age; η2 = 0.007, p = 0.09; sex; η2 = 0.051, p < 0.001) analyses were similar.
Conclusion: Results and, hence, inferences concerning age and sex-based differences in time spent sedentary and in physical activity at work differed between CoDA and standard analysis. We encourage researchers to use CoDA in similar studies, to adequately account for the compositional nature of data on physical activity and sedentary behavior.
Keywords: Accelerometry; Age; CoDA; CoDA-based MANOVA; Isometric log-ratio; Sex.
Conflict of interest statement
Ethics approval and consent to participate
All workers provided their written informed consent prior to participation. The DPHACTO study was conducted according to the Helsinki declaration and approved by the regional Ethics Committee (The Capital Region of Denmark, H-2-2012-011).
Competing interests
The authors declare that they have no competing interests.
Publisher’s Note
Springer Nature remains neutral with regard to jurisdictional claims in published maps and institutional affiliations.
Figures
References
-
- Young DR, Hivert MF, Alhassan S, Camhi SM, Ferguson JF, Katzmarzyk PT, Lewis CE, Owen N, Perry CK, Siddique J, et al. Sedentary behavior and cardiovascular morbidity and mortality: a science advisory from the American Heart Association. Circulation. 2016;134:e262–e279. doi: 10.1161/CIR.0000000000000440. - DOI - PubMed
Publication types
MeSH terms
Grants and funding
LinkOut - more resources
Full Text Sources
Other Literature Sources
Medical
