Review
. 2018 Aug;34(8):639-651.
doi: 10.1016/j.tig.2018.05.007. Epub 2018 Jun 11.

Harnessing Tumor Evolution to Circumvent Resistance

Affiliations
Review

Harnessing Tumor Evolution to Circumvent Resistance

Katherine L Pogrebniak et al. Trends Genet. 2018 Aug.

Abstract

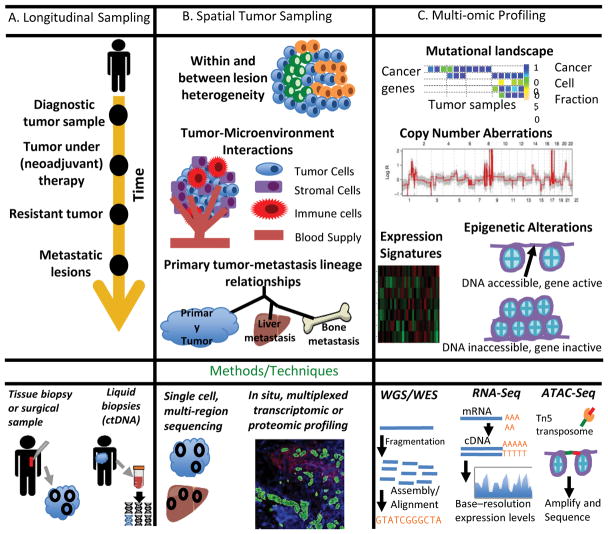
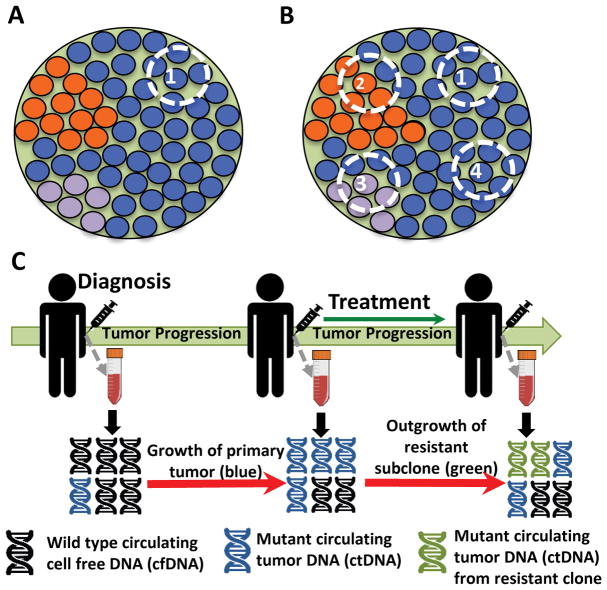
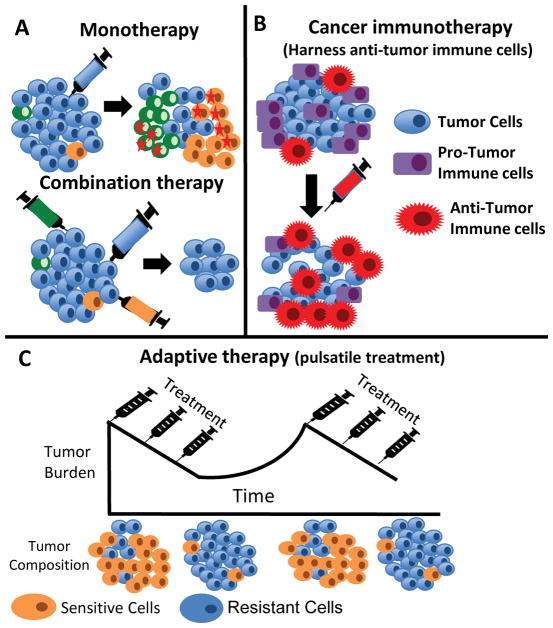
High-throughput sequencing can be used to measure changes in tumor composition across space and time. Specifically, comparisons of pre- and post-treatment samples can reveal the underlying clonal dynamics and resistance mechanisms. Here, we discuss evidence for distinct modes of tumor evolution and their implications for therapeutic strategies. In addition, we consider the utility of spatial tissue sampling schemes, single-cell analysis, and circulating tumor DNA to track tumor evolution and the emergence of resistance, as well as approaches that seek to forestall resistance by targeting tumor evolution. Ultimately, characterization of the (epi)genomic, transcriptomic, and phenotypic changes that occur during tumor progression coupled with computational and mathematical modeling of tumor evolutionary dynamics may inform personalized treatment strategies.

Keywords: clonal dynamics; computational modeling; therapeutic resistance; tissue correlative studies; tumor evolution.


Figures

Figure 1 (Key Figure)
Figure 1 (Key Figure). Characterizing the spatio-temporal dynamics and mechanisms of resistance
A. Longitudinal sampling can be used to track molecular changes during disease progression. In addition to solid tumor samples, liquid biopsies are particularly useful for studying temporal evolution. B. Spatial sampling can be used to characterize within and between lesion heterogeneity and to define tumor-immune cell interactions, all of which play a role in resistance. Single-cell sequencing methods examine heterogeneity at an extremely local level. In situ, multiplexed proteomic techniques, such as Nanostring digital spatial profiling, allow for the study of the co-evolution of the tumor and immune microenvironment during treatment. C. Multi-scale profiling at the genomic, transcriptomic, proteomic, and epigenomic levels can provide a complete picture of functional and non-functional heterogeneity. At the genomic level, tumor tissue can be characterized via the mutational landscape and copy number aberrations. ATAC-seq can be used to study epigenetic alterations.
Figure 2
Figure 2. Sampling strategies to infer evolutionary dynamics
For the tumor schematics in A and B, the green background indicates clonal alterations present in all tumor cells whereas other colors correspond to subclonal alterations that may be undetected due to spatial heterogeneity A. Sequencing of single tumor sample (e.g. diagnostic biopsy) illustrates that subclonal alterations and intratumor heterogeneity (ITH) may be overlooked. B. Multi-region sequencing (MRS) can better capture ITH and enables discovery of clonal versus subclonal alterations, which can, in turn, reveal the underlying evolutionary dynamics of the tumor. C. Liquid biopsies allow for ctDNA profiling, which provide a tractable method for the longitudinal characterization of clonal dynamics in the context of therapy and can be used to monitor the emergence of resistance prior to clinical manifestation on imaging.
Figure 3
Figure 3. Approaches to forestall resistance
A. Tumor schematic comparing the effects of monotherapy and combination therapy. Combination therapy treats a tumor with multiple drugs (different colored syringes) at the same time. This therapeutic strategy constrains the evolutionary trajectory of the tumor and prevents the development of more aggressive clones (orange and green cells marked with red stars) that would already be resistant to the second or third-line agents. B. Tumor schematic describing treatments targeting tumor-immune cell interactions. Cancer immunotherapy leverages the relationship between the tumor and its surrounding microenvironment to activate anti-tumor immune cells (eg CD4+ cells, NK cells, and B cells) and downregulate pro-tumor immune cells such as Tregs. C. Tumor schematic describing adaptive therapy. Adaptive therapy constrains the evolution of tumors with multiple competing subclones, some of which are resistant to therapy. In this schema, the blue cells are resistant to the treatment while the orange cells are sensitive. Treatment is given in a pulsatile manner such that the sensitive and resistant cell populations grow in the “off” and “on” phases of treatment, respectively. Ideally, both populations are maintained, but growth of the resistant subclone(s) is competitively constrained by neighboring sensitive cells.

References

    1. Scott A, et al. Antibody therapy of cancer. Nat Rev Cancer. 2012;12:278–287. - PubMed
    1. Ledermann J, et al. Olaparib maintenance therapy in patients with platinum-sensitive relapsed serous ovarian cancer: a preplanned retrospective analysis of outcomes by BRCA status in a randomised phase 2 trial. Lancet Oncol. 2014;15:852–861. - PubMed
    1. Druker B, et al. K-ras Mutations and Benefit from Cetuximab in Advanced Colorectal Cancer. N Engl J Med. 2006;359:1757–1765. - PubMed
    1. Holohan C, et al. Cancer drug resistance: an evolving paradigm. Nat Rev Cancer. 2013;13:714–726. - PubMed
    1. Das Thakur M, et al. Modelling vemurafenib resistance in melanoma reveals a strategy to forestall drug resistance. Nature. 2013;494:251–255. - PMC - PubMed

Publication types

Substances