. 2018 Jun 26;2(12):1393-1402.
doi: 10.1182/bloodadvances.2018018440.

Severely impaired terminal erythroid differentiation as an independent prognostic marker in myelodysplastic syndromes

Affiliations

Severely impaired terminal erythroid differentiation as an independent prognostic marker in myelodysplastic syndromes

Abdullah Mahmood Ali et al. Blood Adv. .

Abstract

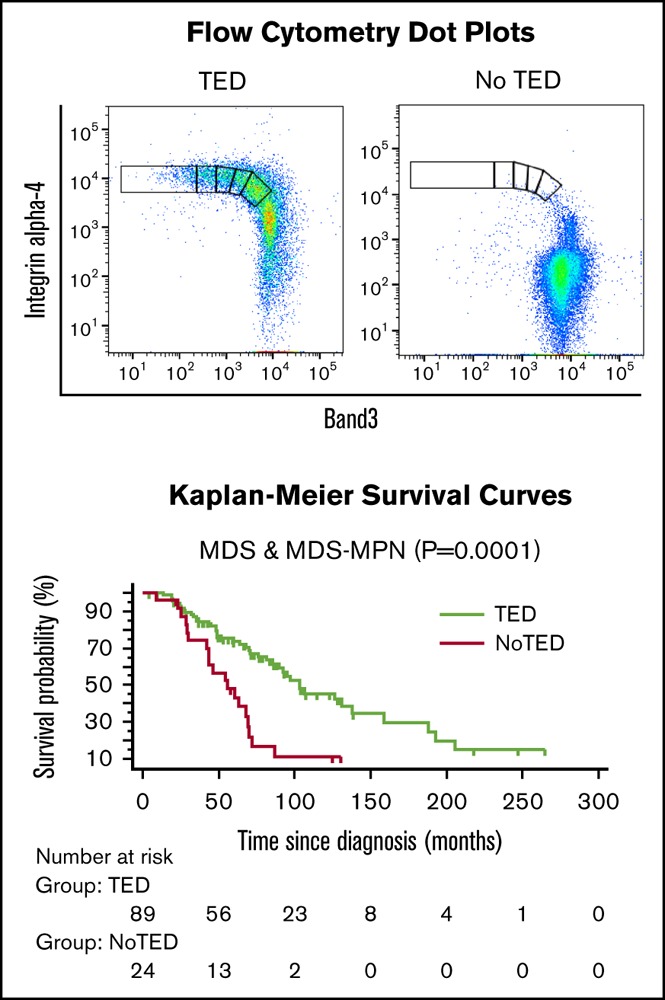
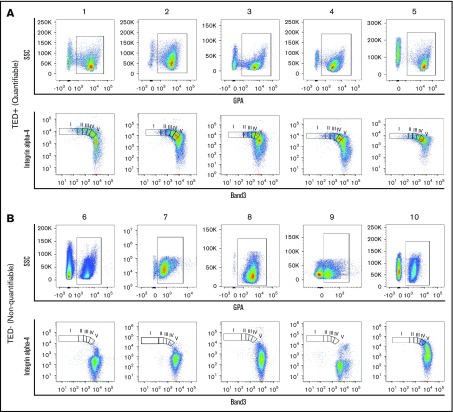
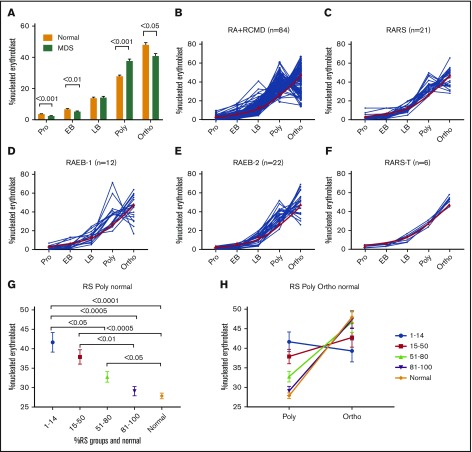
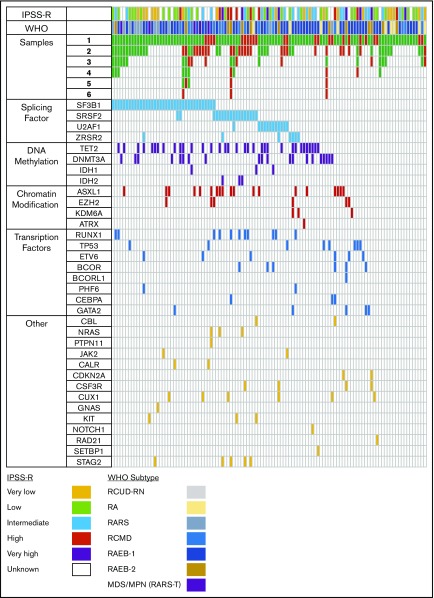
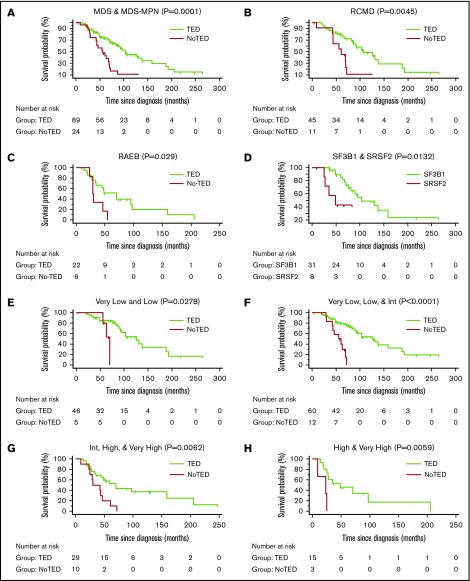
Anemia is the defining feature in most patients with myelodysplastic syndromes (MDS), yet defects in erythropoiesis have not been well characterized. We examined freshly obtained bone marrow (BM) samples for stage-specific abnormalities during terminal erythroid differentiation (TED) from 221 samples (MDS, n = 205 from 113 unique patients; normal, n = 16) by measuring the surface expression of glycophorin A, band 3, and integrin α-4. Clinical and biologic associations were sought with presence or absence of TED and the specific stage of erythroid arrest. In 27% of MDS samples (56/205), there was no quantifiable TED documented by surface expression of integrin α-4 and band 3 by terminally differentiating erythroblasts. Absence of quantifiable TED was associated with a significantly worse overall survival (56 vs 103 months, P = .0001) and SRSF2 mutations (7/23, P < .05). In a multivariable Cox proportional hazards regression analysis, absence of TED remained independently significant across International Prognostic Scoring System-Revised (IPSS-R) categories, myeloid/erythroid ratio, and mutations in several genes. In 149/205 MDS samples, the proportion of cells undergoing TED did not follow the expected 1:2:4:8:16 doubling pattern in successive stages. Absence of TED emerged as a powerful independent prognostic marker of poor overall survival across all IPSS-R categories in MDS, and SRSF2 mutations were more frequently associated with absence of TED.


Conflict of interest statement

Conflict-of-interest disclosure: The authors declare no competing financial interests.

Figures

None
Graphical abstract
Figure 1.
Figure 1.
Flow cytometry profiles of patient samples. Representative dot plots of TED profiles, as observed on flow cytometry, obtained from primary human BM of MDS samples from (A) 5 quantifiable samples and (B) 5 nonquantifiable samples. GPA+ cells (A-B, top) were found in both quantifiable and nonquantifiable samples, but the nonquantifiable samples were characterized by (B, top) low GPA expression and (B, bottom) absence of cells undergoing TED. I, II, III, IV, V, represent pro, EB, LB, poly, ortho stages of TED; SSC, side scatter.
Figure 2.
Figure 2.
TED is abnormal in patient samples. (A) Bar diagram showing percentage of nucleated erythroid cells in each stage of TED. When compared with normal (n = 16), MDS/MDS-MPN/secondary acute myeloid leukemia samples (n = 95) were characterized by a significant decrease in percentage of cells in pro and EB stages and a significantly abnormal increase of cells in the poly stage, and a decrease in the ortho stage. Data in bar diagram are presented as mean ± standard error of the mean. Each TED stage was compared between normal and MDS samples using unpaired, 2-tailed, nonparametric t test (Mann-Whitney U). (B-F) Line plot showing percentage of cells quantified in each TED stage in individual samples of WHO subgroups. (B) RA and RCMD, (C) RARS, (D) RAEB-1, (E) RAEB-2, and (F) RARS-T. Red line is the mean percentage of cells observed in normal individuals. (G-H) RS subgroups and TED. (G) Pot showing percentage of nucleated erythroblast cells in the poly stage within various RS subgroups and normal samples. There was significant difference in the poly stage between different RS subgroups; less cell arrest was observed in the poly stage as RS increased. All data are presented as mean ± standard error of the mean. Samples were compared using 1-way analysis of variance (Kruskal-Wallis test); multiple comparisons were done using the uncorrected Dunn test. (H) A graph showing inverse relation between poly and ortho stages within various RS groups and normal. Less arrest in poly is translated into more ortho stages. RA, refractory anemia; RS, ring sideroblast.
Figure 3.
Figure 3.
Mutational analysis. Graphic representation of number of samples analyzed for each patient (N = 112) and mutations observed in the first sample analyzed. Green box, sample on whom TED profile was obtained; red box, the sample was adequate but no cells were found undergoing TED. Each column represents 1 unique patient. Although for some patients, every sample analyzed at different time points showed TED, there were others who failed to show cells in TED at every point analyzed; there were some samples that failed to show cells in TED at 1 or more point. Colored boxes colored according to their functional group in mutation panels show presence of mutation in that gene and patient. Splicing factor mutations were more common followed by DNA methylation. Bottom, color codes for the IPSSR and WHO categories.
Figure 4.
Figure 4.
Survival curves. Kaplan-Meier survival curves were generated to calculate OS. OS among patients in whom TED profile was obtained (TED) compared with patients in whom sample was adequate but no cells were found undergoing TED (NoTED). There was a significant difference in OS between TED and NoTED among (A) all patients: MDS (n = 108) and RARS-T (n = 6) (P = .0001), (B) RCMD patients (P = .0045), and (C) RAEB (RAEB-1 and RAEB-2) patients (P = .029). (D) We also found a difference in OS between patients with TED and SF3B1 or SRSF2 mutations (P = .0132). (E) IPSS-R very low and low categories (P = .0278); (F) very low, low, and intermediate categories (P < .0001); (G) intermediate, high, and very high categories (P = .0062); and (H) high and very high categories (P = .0059). Log-rank tests were used to compare the curves. The tables below the curves indicate the number of patients at risk in each group.

References

    1. Raza A, Galili N. The genetic basis of phenotypic heterogeneity in myelodysplastic syndromes. Nat Rev Cancer. 2012;12(12):849-859. - PubMed
    1. Greenberg PL, Tuechler H, Schanz J, et al. . Revised international prognostic scoring system for myelodysplastic syndromes. Blood. 2012;120(12):2454-2465. - PMC - PubMed
    1. Pomares H, Sánchez-Ortega I, Alonso E, et al. . Validation of the Low Risk Prognostic Scoring System (LR-PSS) in patients with very low, low and intermediate risk IPSS-R myelodysplastic syndrome. Results from a single center. Blood. 2015;126(23):2902.
    1. Bejar R, Stevenson KE, Caughey BA, et al. . Validation of a prognostic model and the impact of mutations in patients with lower-risk myelodysplastic syndromes. J Clin Oncol. 2012;30(27):3376-3382. - PMC - PubMed
    1. Shiozawa Y, Malcovati L, Gallì A, et al. . Gene expression and risk of leukemic transformation in myelodysplasia. Blood. 2017;130(24):2642-2653. - PubMed

Publication types

Substances