. 2018 Jul;28(7):952-967.
doi: 10.1101/gr.226324.117. Epub 2018 Jun 14.

Human primitive brain displays negative mitochondrial-nuclear expression correlation of respiratory genes

Affiliations

Human primitive brain displays negative mitochondrial-nuclear expression correlation of respiratory genes

Gilad Barshad et al. Genome Res. 2018 Jul.

Erratum in

Abstract

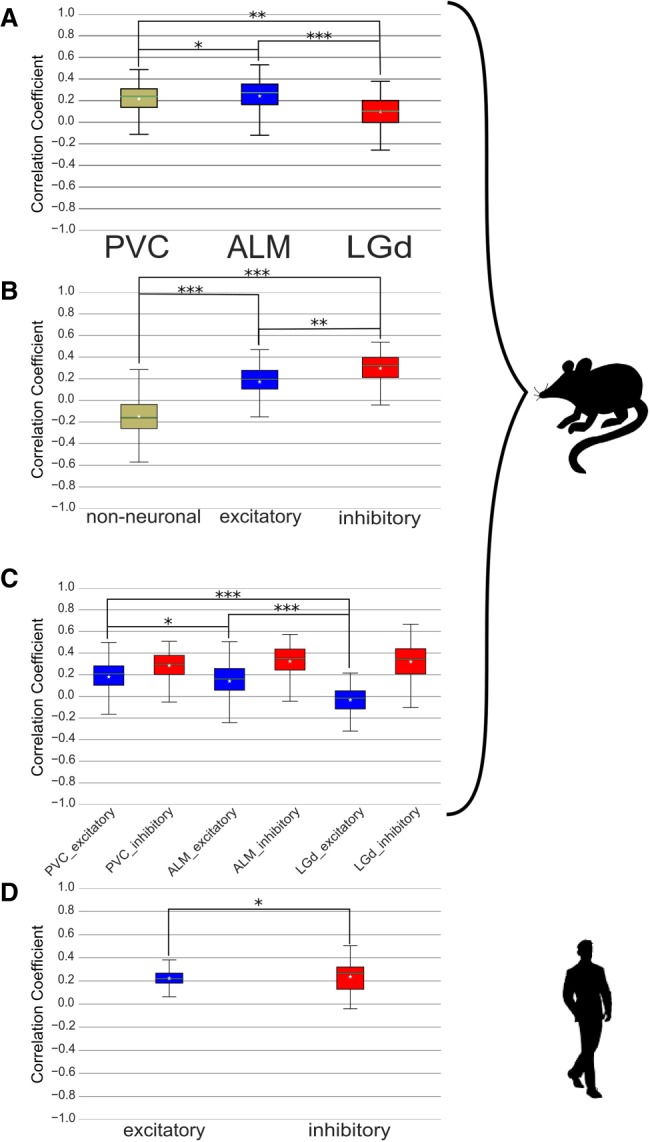
Oxidative phosphorylation (OXPHOS), a fundamental energy source in all human tissues, requires interactions between mitochondrial (mtDNA)- and nuclear (nDNA)-encoded protein subunits. Although such interactions are fundamental to OXPHOS, bi-genomic coregulation is poorly understood. To address this question, we analyzed ∼8500 RNA-seq experiments from 48 human body sites. Despite well-known variation in mitochondrial activity, quantity, and morphology, we found overall positive mtDNA-nDNA OXPHOS genes' co-expression across human tissues. Nevertheless, negative mtDNA-nDNA gene expression correlation was identified in the hypothalamus, basal ganglia, and amygdala (subcortical brain regions, collectively termed the "primitive" brain). Single-cell RNA-seq analysis of mouse and human brains revealed that this phenomenon is evolutionarily conserved, and both are influenced by brain cell types (involving excitatory/inhibitory neurons and nonneuronal cells) and by their spatial brain location. As the "primitive" brain is highly oxidative, we hypothesized that such negative mtDNA-nDNA co-expression likely controls for the high mtDNA transcript levels, which enforce tight OXPHOS regulation, rather than rewiring toward glycolysis. Accordingly, we found "primitive" brain-specific up-regulation of lactate dehydrogenase B (LDHB), which associates with high OXPHOS activity, at the expense of LDHA, which promotes glycolysis. Analyses of co-expression, DNase-seq, and ChIP-seq experiments revealed candidate RNA-binding proteins and CEBPB as the best regulatory candidates to explain these phenomena. Finally, cross-tissue expression analysis unearthed tissue-dependent splice variants and OXPHOS subunit paralogs and allowed revising the list of canonical OXPHOS transcripts. Taken together, our analysis provides a comprehensive view of mito-nuclear gene co-expression across human tissues and provides overall insights into the bi-genomic regulation of mitochondrial activities.


Figures

Figure 1.
Figure 1.
OXPHOS gene expression patterns across all tissues support the general coregulation of mito-nuclear gene expression. A heat map of correlation values for the expression of all OXPHOS genes. The four clusters (redundant paralogs, mtDNA, main OXPHOS cluster, and lower similarity cluster) are framed in squares (red, green, full blue, and dashed blue line, respectively). A key for the color code of the Spearman's correlation coefficients is shown in top left corner.
Figure 2.
Figure 2.
The overall positive co-expression of mitochondrial and nuclear genes is limited to OXPHOS structural subunits, excluding assembly factors. (A) A histogram panel demonstrating expression correlation distributions between mtDNA-encoded OXPHOS genes and either genome-wide non-OXPHOS genes (green), non-OXPHOS protein coding genes (red), or nDNA-encoded OXPHOS genes (blue). (B) A histogram panel demonstrating expression correlation distributions between mtDNA-encoded OXPHOS gene and either nDNA-encoded non-OXPHOS mitochondrial proteins listed in MitoCarta2.0 (Calvo et al. 2016) (red), a MitoCarta subset of mitochondrial inner-membrane proteins (yellow), and nDNA-encoded OXPHOS genes as a reference (blue). (C) Box plots representing the correlations (Spearman's correlation coefficients) between nDNA-encoded OXPHOS genes (intra-OXPHOS) versus their correlations with OXPHOS complexes assembly factors genes. Star: average value. (D) Box plots representing the correlations (Spearman's correlation coefficients) of mtDNA OXPHOS genes with nDNA OXPHOS genes versus their correlations with OXPHOS assembly factors. Red lines: median correlation coefficient; stars: average correlation coefficient. (***) P < 1 × 10−100.
Figure 3.
Figure 3.
The various gene paralogs of COX6A and COX7A are co-expressed with OXPHOS genes in various tissues. (A) Box plot demonstrating the distributions of expression correlations of OXPHOS genes with the grouped (collapsed) paralogs per each of the following seven OXPHOS subunits: COX4I, COX6A2, COX6B, COX7A2, COX7B, COX8, and ATP5MG) (greenish gray) and the expression vectors of the indicated gene paralogs (blue, red, and green). (B) A heat map demonstrating OXPHOS genes expression correlation values with COX6A and COX7A paralogs, considering the 48 different tissues tested in the current study.
Figure 4.
Figure 4.
“Primitive” brain reveals a negative mito-nuclear expression pattern and an overall increase in OXPHOS gene expression levels. (A) A schematic illustration of human brain cross-section, roughly dividing the brain into associated with the “primitive” (blue) or other brain regions (red). (B) A box plot representing Spearman's correlation coefficients between either the entire genome (greenish gray) or nDNA-encoded OXPHOS genes with mtDNA genes (blue) in all nonbrain body sites, in an aggregate of all “primitive” brain regions (that each showed negative mito-nuclear OXPHOS genes correlations, separately) and in all other brain regions as well (see Supplemental Data Sets S1, S2). Red lines: median correlation coefficient; stars: average correlation coefficient. (***) P < 1 × 10−100. (C,D) Box plots representing the expression of mtDNA-encoded (C) and nDNA-encoded (D) OXPHOS genes relative to the median expression across all 48 tested tissues, in all nonbrain body sites (greenish-gray), in an aggregate of all “primitive” brain regions that showed (separately) negative mito-nuclear OXPHOS genes correlations (blue), and in all other brain tissues (red) (see Supplemental Data Sets S1, S2). Red lines: median correlation coefficient; stars: average correlation coefficient. (**) P < 1 × 10⁻¹⁰.
Figure 5.
Figure 5.
Single-cell RNA-seq analysis indicate spatial and cell-type–dependent effect on OXPHOS mito-nuclear genes co-expression. (A) Box plots showing Spearman's rank OXPHOS mito-nuclear expression correlation values in a bulk of mouse brain cells, grouped according to their brain region collection site. Star: average value (in all subsequent panels). (B) Box plots showing Spearman's rank OXPHOS mito-nuclear expression correlation values in mouse brain cells, bulked according to their assigned cell type. (C) Box plots showing Spearman's rank OXPHOS mito-nuclear expression correlation values in mouse brain neurons, bulked according to brain regions and neuronal type. (D) Box plots showing Spearman's rank OXPHOS mito-nuclear expression correlation values in human brain cells (nuclei), bulked according to their assigned neuronal cell type.
Figure 6.
Figure 6.
Candidate factors that best explain mito-nuclear coregulation. (A) Bar plot showing 15 transcription factors that bind cis-regulatory elements of nDNA-encoded OXPHOS genes in vivo and correlate with their co-expression. (B,C) Bar plots of the expression correlations between either the genes encoding mtRNA-binding protein SLIRP (B) or the mtDNA-binding transcription factor CEBPB (C) with the median expression values of mtDNA- (green bars) and nDNA-encoded (red bars) OXPHOS genes. Blue bars represent the median value of correlation between mtDNA- and nDNA-encoded OXPHOS genes.
Figure 7.
Figure 7.
Tissue-dependent expression correlation of NDUFV3 and ATP5F1C splice-isoforms with the main OXPHOS cluster. (A,B) Heat maps representing relative expression correlations between NDUFV3 (A) and ATP5F1C (B) splice-variants and the “main OXPHOS transcript cluster.”

References

    1. Aloni Y, Attardi G. 1971. Symmetrical in vivo transcription of mitochondrial DNA in HeLa cells. Proc Natl Acad Sci 68: 1757–1761. - PMC - PubMed
    1. Azevedo FA, Carvalho LR, Grinberg LT, Farfel JM, Ferretti RE, Leite RE, Lent R, Herculano-Houzel S. 2009. Equal numbers of neuronal and nonneuronal cells make the human brain an isometrically scaled-up primate brain. J Comp Neurol 513: 532–541. - PubMed
    1. Barton RA, Venditti C. 2014. Rapid evolution of the cerebellum in humans and other great apes. Curr Biol 24: 2440–2444. - PubMed
    1. Baughman JM, Nilsson R, Gohil VM, Arlow DH, Gauhar Z, Mootha VK. 2009. A computational screen for regulators of oxidative phosphorylation implicates SLIRP in mitochondrial RNA homeostasis. PLoS Genet 5: e1000590. - PMC - PubMed
    1. Blumberg A, Sailaja BS, Kundaje A, Levin L, Dadon S, Shmorak S, Shaulian E, Meshorer E, Mishmar D. 2014. Transcription factors bind negatively selected sites within human mtDNA genes. Genome Biol Evol 6: 2634–2646. - PMC - PubMed

Publication types

LinkOut - more resources