. 2018 Aug;8(8):1006-1025.
doi: 10.1158/2159-8290.CD-17-1371. Epub 2018 Jun 14.

Adipocyte-Derived Lipids Mediate Melanoma Progression via FATP Proteins

Affiliations

Adipocyte-Derived Lipids Mediate Melanoma Progression via FATP Proteins

Maomao Zhang et al. Cancer Discov. 2018 Aug.

Abstract

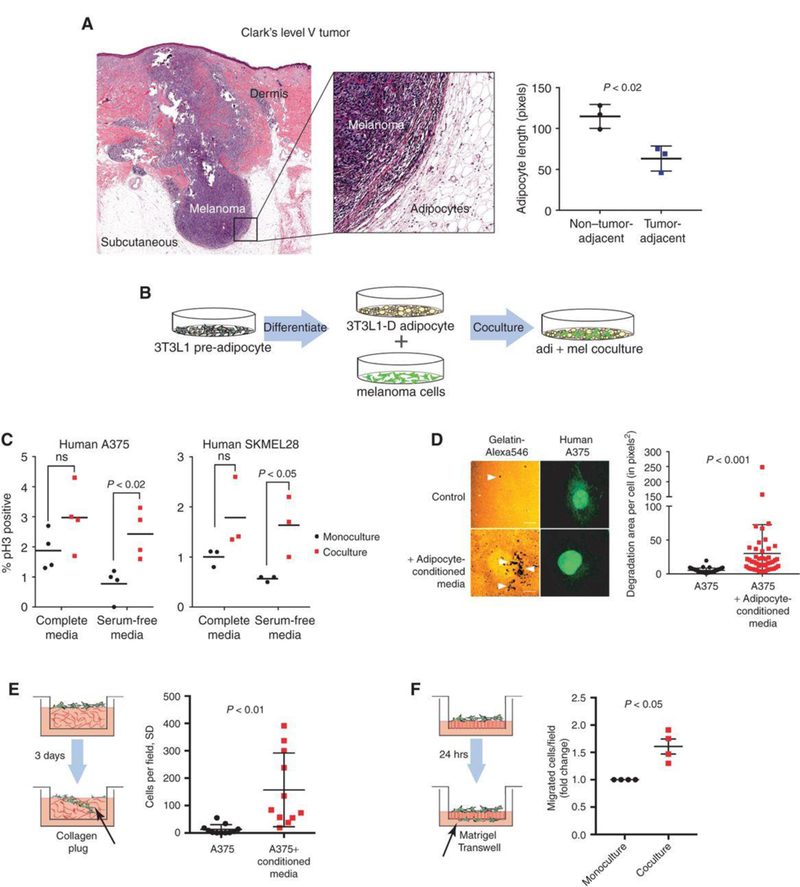
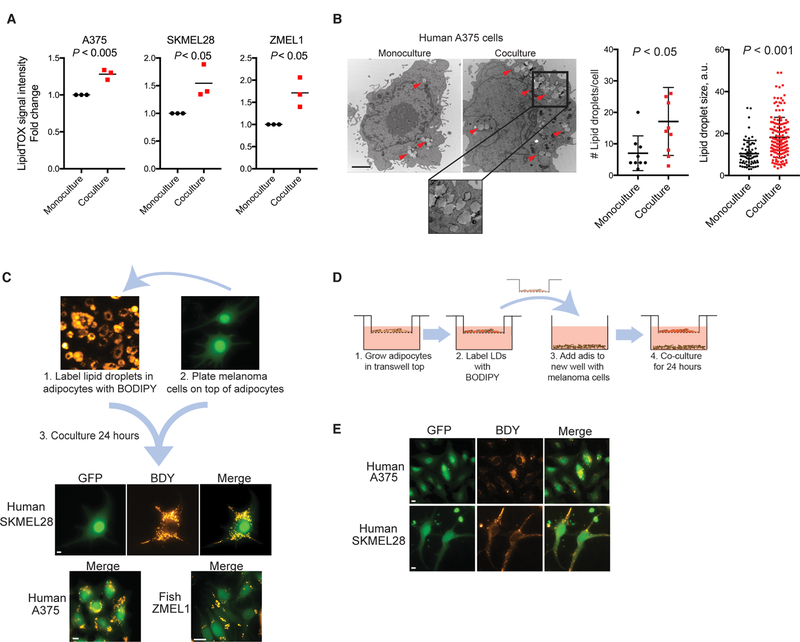
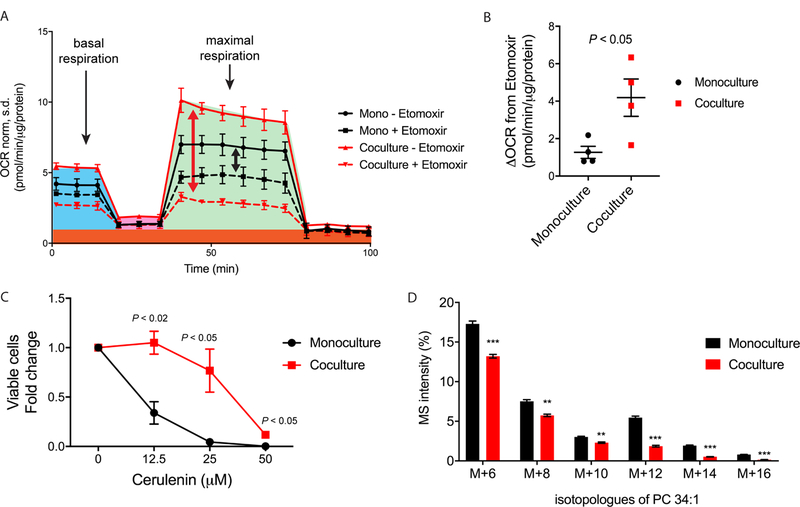
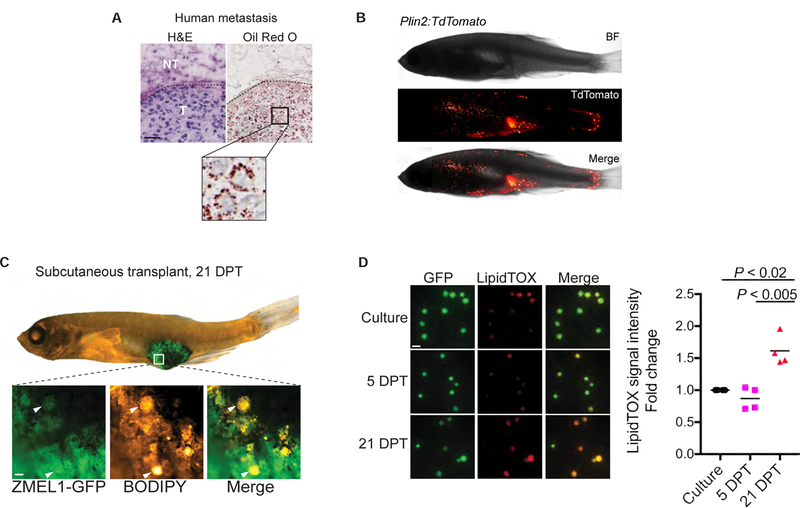
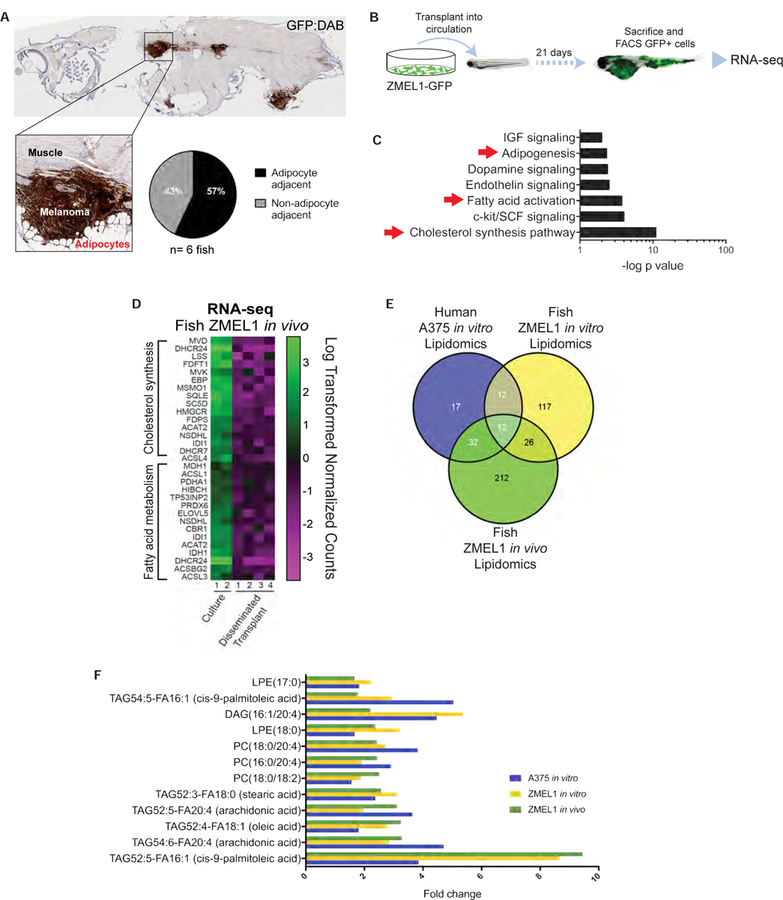
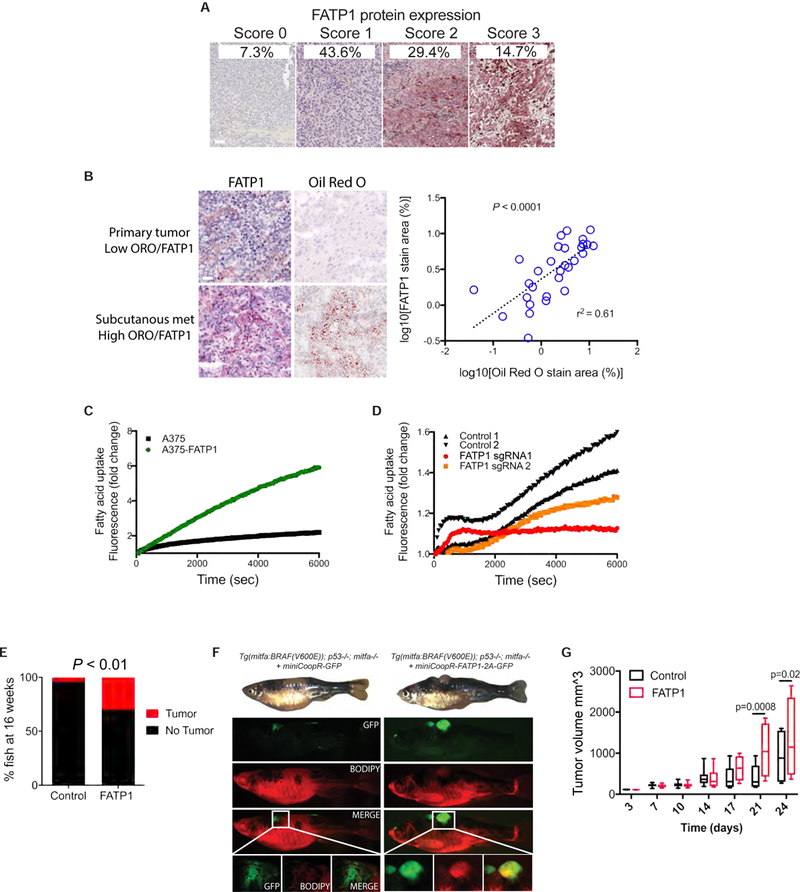
Advanced, metastatic melanomas frequently grow in subcutaneous tissues and portend a poor prognosis. Though subcutaneous tissues are largely composed of adipocytes, the mechanisms by which adipocytes influence melanoma are poorly understood. Using in vitro and in vivo models, we find that adipocytes increase proliferation and invasion of adjacent melanoma cells. Additionally, adipocytes directly transfer lipids to melanoma cells, which alters tumor cell metabolism. Adipocyte-derived lipids are transferred to melanoma cells through the FATP/SLC27A family of lipid transporters expressed on the tumor cell surface. Among the six FATP/SLC27A family members, melanomas significantly overexpress FATP1/SLC27A1. Melanocyte-specific FATP1 expression cooperates with BRAFV600E in transgenic zebrafish to accelerate melanoma development, an effect that is similarly seen in mouse xenograft studies. Pharmacologic blockade of FATPs with the small-molecule inhibitor Lipofermata abrogates lipid transport into melanoma cells and reduces melanoma growth and invasion. These data demonstrate that stromal adipocytes can drive melanoma progression through FATP lipid transporters and represent a new target aimed at interrupting adipocyte-melanoma cross-talk.Significance: We demonstrate that stromal adipocytes are donors of lipids that mediate melanoma progression. Adipocyte-derived lipids are taken up by FATP proteins that are aberrantly expressed in melanoma. Inhibition of FATPs decreases melanoma lipid uptake, invasion, and growth. We provide a mechanism for how stromal adipocytes drive tumor progression and demonstrate a novel microenvironmental therapeutic target. Cancer Discov; 8(8); 1006-25. ©2018 AACR.This article is highlighted in the In This Issue feature, p. 899.


Conflict of interest statement

Conflict of interest statement:

The authors declare no conflict of interest.

Competing Financial Interests

The authors declare no competing financial interests.

Figures

Figure 1:
Figure 1:. Tumor-adjacent adipocytes contribute to melanoma progression
(A) H&E staining on a Clark’s Level V tumor. Vertical growth in the tumor (Mel) exposes melanoma cells to dermis as well as subcutaneous tissues which is mainly composed of adipocytes. Graph shows quantification of maximum length of tumor-adjacent adipocytes and non-tumor adjacent adipocytes. Each data point represents the average length of 10–15 tumor-adjacent and 10–15 non-tumor adjacent adipocytes for n=3 regions of interest in section. Error bars indicate s.d. Two-tailed unpaired T-test. (B) Schematic showing the adipocyte-melanoma coculture system. (C) Phosho-H3 staining in SKMel28-GFP and A375-GFP cells co-cultured with 3T3L1 adipocytes for 24 hours. %pH3 was calculated by counting the number of pH3+ nuclei over total number of GFP+ cells/field. Each data point represents an average of >10 fields/condition. Two-tailed unpaired T-test, n≥3 independent experiments. (D) Gelatin degradation assay to measure invasive capacity of A375-GFP cells. A375-GFP cells were seeded on gelatin matrix and grown in control media or adipocyte-conditioned media for 24 hours. Degradation was calculated as the area of degraded gelatin as a proportion of total cell area. Representative images are shown. Error bars indicate s.d. T-test with Welch correction, n=3 independent experiments. Scale bar is 10μm. Arrowheads indicate areas of degradation. (E) A375-GFP were seeded on top of collagen-polymerized matrix and allowed to invade for 3 days. Quantification was done counting the number of cells invaded 30–60 μm into the collagen matrix per field (black arrow). Error bars represent s.d. Two-tailed unpaired T-test with Welch’s correction, n=3 independent experiments. (F) Matrigel transwell migration of FACS-isolated A375-GFP cells in monoculture or after co-culture with 3T3L1 adipocytes for 7 days. Quantification was done counting the number of cells on the bottom side of the transwell (black arrow) calculated as fold change of number of cells in co-cultured cells compared to monoculture controls. Each data point represents an average of ≥3 fields/condition per independent experiment. Two-tailed unpaired T-test with Welch’s correction, n=4 independent experiments.
Figure 2:
Figure 2:. Adipocytes increase melanoma cell lipid content via adipocyte/ melanoma lipid transfer
(A) LipidTOX staining on ZMEL1-GFP, SKMel28-GFP and A375-GFP cells that were co-cultured with 3T3L1 adipocytes for 7 days then FACS-isolated . LipidTOX staining intensity was quantified and calculated as fold change of LipidTOX staining in co-cultured cells compared to monoculture controls. Each data point represents an average of >10 fields/condition per independent experiment. Mean is shown. Two-tailed unpaired T-test, n=3 independent experiments. (B) Transmission electron microscopy (TEM) of A375-GFP cells FACS-isolated after coculture with 3T3L1 adipocytes for 7 days compared to monoculture controls. Error bars indicate s.d. Two-way unpaired T-test with Welch correction, n=10 cells/condition. Scale bar is 2μm. Representative images are shown. (C) Transfer of BODIPY fluorescent fatty acid from adipocytes to melanoma cells. 3T3L1 adipocytes were grown alone and lipid droplets were labeled with BODIPY. After washing away extracellular BODIPY, ZMEL1-GFP, SKMel28-GFP or A375-GFP cells were plated on top and co-cultured with BODIPY-labeled adipocytes for 24 hours then fixed and imaged. Representative images shown, n=3 independent experiments. Scale bars are 10μm. (D) 3T3L1 adipocytes were grown alone on the top portion of a Transwell and lipid droplets were labeled with BODIPY. After washing away extracellular BODIPY, Transwell insert containing adipocytes were transferred to a new well containing ZMEL1-GFP, SKMel28-GFP or A375-GFP cells. (E) ZMEL1-GFP, SKMel28-GFP or A375-GFP cells were cocultured for 24 hours then fixed and imaged. Representative images shown, n=3 independent experiments. Scale bars are 10μm.
Figure 3:
Figure 3:. Adipocytes alter melanoma cell fatty acid metabolism
(A) Mitochondrial respiration of FACS-isolated A375-GFP cells in monoculture or after co-culture with 3T3L1 adipocytes for 7 days with or without pretreatment with the CPT1 inhibitor etomoxir. Oxygen consumption rate (OCR) was measured under basal conditions followed by the sequential addition of oligomycin (1 μM), FCCP (2 μM), rotenone (1 μM) or antimycin A (1 μM). Representative experiment is shown of n=4 independent experiments. Error bars indicate s.d. (B) Quantification of change (Δ) in maximal OCR with treatment of 40 μM etomoxir in monoculture and cocultured A375-GFP cells. Two-tailed unpaired t-test with Welch’s correction, n=4 independent experiments. (C) Quantification of A375-GFP cells in monoculture or in coculture with adipocytes with or without various doses of the FASN inhibitor cerulenin, calculated as fold change compared to vehicle controls. Two-tailed unpaired t-test with Welch’s correction, n=4 independent experiments. (D) Relative abundance of 13C-labeled isotopologues of PC34:1 were quantified for A375 cells in monoculture or after coculture with adipocytes for 7 days and treated with 13C-acetate for 24 hours. Multiple two-tailed T-test with Holm-Sidak test for multiple comparisons. **P< 0.005, ***P< 0.001
Figure 4:
Figure 4:. Adipocytes increase melanoma cell lipid content in vivo
(A) Patient-derived subcutaneous acral melanoma metastases stained with H&E and Oil Red O. Scale bar is 100μm. (B) Casper transparent adult zebrafish with adipocyte-specific TdTomato expression driven by the Plin2 promoter. (C) Adult Casper at 21 DPT with ZMEL1-GFP cells. Fish is stained with BODIPY 558/568 to visualize lipids. Insets show BODIPY-labeled GFP+ cells, revealing a subset of tumor cells that are lipid-laden. Representative images are shown. Double positive cells were observed in n=16/21 transplanted fish. Scale bar is 50μm. (D) ZMEL1-GFP cells were transplanted subcutaneously into adult Casper fish until 5 or 21 DPT then FACS-isolated and stained for total lipid content with LipitTOX. LipidTOX staining intensity was quantified calculated as fold change of LipidTOX staining in transplanted ZMEL1 cells compared to cultured parental controls. Each data point represents an average of >10 fields/condition per independent experiment. Mean is shown. Two-tailed unpaired T-test, n=4 independent experiments. Scale bar is 20μm.
Figure 5:
Figure 5:. Subcutaneous metastases grow next to adipocytes and dysregulate lipid genes
(A) GFP staining of a casper transplanted fish at 18 DPT showing adipocyte-adjacent and non-adipocyte adjacent metastases. For n=6 fish, total number of metastases and number of metastases next to adipocytes were quantified. B) Schematic of evaluating melanoma metastasis using transplantation into zebrafish larvae. ZMEL1-GFP cells were transplanted into the vasculature of a fish at 2 days post fertilization (DPF). At 21 days post-transplant (DPT), when fish had widespread tumor dissemination, GFP+ cells were isolated by fluorescence-activated cell sorting (FACS). Parental ZMEL1-GFP cells maintained in culture were also subject to FACS sorting, and gene expression profiling was performed on the two cell populations. (C) Ingenuity Pathway Analysis of ZMEL1-GFP cells after metastatic dissemination suggests seven pathways that could mediate microenvironmental effects on melanoma growth. P-values indicate estimated likelihood that the indicated pathway is altered in the RNA-seq data set. (D) Heatmap of RNA-seq expression of genes with significant differential expression between zebrafish ZMEL1 cells grown either in culture or in disseminated transplants in zebrafish, showing downregulated genes that are typical SREBP targets. (E) Common lipid species that are increased in human A375 (blue) or zebrafish ZMEL1 cells (yellow) grown in coculture with adipocytes (compared to monoculture) and from zebrafish ZMEL1 cells grown in subcutaneous transplants in zebrafish (compared to parental cells in culture) (green). (F) 12 lipid species that commonly increased between in vitro human A375 and zebrafish ZMEL1 cells cocultured with adipocytes and from ZMEL1 cells grown in subcutaneous transplants. Two-tailed unpaired T-test, n=3, P<0.05.
Figure 6:
Figure 6:. Aberrantly expressed FATP1 mediates lipid uptake in human melanomas
(A) Immunohistochemistry images of endogenous FATP1 in a panel of 105 clinically defined human melanoma tumor samples. Representative images are shown. Score 0 represents no FATP staining, scores 1 and 2 represent low-medium FATP staining and score 3 represents high FATP staining. Scale bar is 100μm. (B) Immunohistochemistry images of low FATP1 expression and ORO staining in a primary tumor and high FATP1 expression and ORO staining in a subcutaneous metastasis. Graph shows correlation of FATP1 expression and ORO staining in n=7 patient samples consisting of one primary tumor and six subcutaneous and non-subcutaneous metastases. r2 based on Spearman’s Rank-Order Correlation coefficient. (C) QBT real time lipid uptake in A375 overexpressing FATP1 compared to control cells. Graph represents mean from n=3 independent experiments. Area under the curve (AUC) was calculated for each curve and differences were compared by 95% confidence intervals. (D) QBT timed lipid uptake in A375 FATP1 CRISPR knockout cells compared to control cells. Graph represents mean from n=3 independent experiments. AUC was calculated for each curve and differences were compared by 95% confidence intervals. sgRNA 1 and 2 had 73% and 55% mutant reads, respectively, validated via sequencing. (E) MiniCoopR-EGFP or MiniCoopR-FATP1 was injected into p53/BRAF/Nacre embryos. Percentages indicate melanoma incidence at 16 weeks of age, statistical differences in tumor incidence quantified with Chi-square test. (F) MiniCoopR-EGFP or MiniCoopR-FATP1 fish were stained with BODIPY-RED to visualize lipid burden in GFP+ tumor regions. Representative images are shown. (G) Tumor volumes over time of nude mice harboring A375-mCherry or A375-FATP1-mCherry subcutaneously xenografted tumors. Asterisks denote p < 0.05. Error bars represent s.d. n=5 individual xenograft mice per group.
Figure 7:
Figure 7:. FATP blockade inhibits melanoma growth and invasion
(A) Lipid uptake assay in A375, SKMel28 and ZMEL1 cells treated with Lipofermata represented as mean fold change over control. n=3 independent experiments. (B) Representative images of lipid transfer assay in the presence of Lipofermata. 3T3L1 adipocytes were maintained on the top chamber of a Transwell insert and intracellular lipid droplets were labeled with BODIPY. After labeling, Transwell inserts with 3T3L1 adipocytes were moved to a well containing melanoma cells and 2.5µM Lipofermata for 24 hours. Each data point represents an average of >10 fields/condition per experiment. Two-tailed unpaired T-test, n=3 independent experiments. Scale bar is 10µm. (C) Cell Titer Glo assay for cell viability on A375, SKMel28 and ZMEL1 cells treated with varying doses of Lipofermata for 72 hours. Data represents mean fold change, n=3 independent experiments. (D) Quantification of A375-GFP cells in monoculture or in coculture with adipocytes with or without Lipofermata, calculated as fold change compared to vehicle controls. Two-tailed unpaired T-test with Welch’s correction, n=3 independent experiments. (E) Gelatin degradation assay to measure invasive capacity of A375-GFP cells cultivated in adipocyte-conditioned media treated with DMSO or 1.5µM Lipofermata. Representative images shown. Error bars indicate s.d. T-test with Welch correction, n=3 independent experiments. Scale bar is 10µm. Arrowheads indicate degradation. (F) Representative images of tumor burden measured by GFP+ tumor area after daily injection of 5 μM Lipofermata into adult Casper fish transplanted with 3 × 10⁶ ZMEL1-GFP cells. Tumor area for each fish, represented as one data point, is shown. Two-tailed unpaired T-test, n=7 Lipofermata-treated fish and n=9 DMSO-treated fish. (G) LipidTOX staining of GFP+ tumor after daily injection of 5 μM Lipofermata into adult Casper fish transplanted with 3 × 10⁶ ZMEL1-GFP cells. LipidTOX intensity was quantified and calculated as fold change of staining Lipofermata-treated tumors compared to DMSO controls. Each data point represents an average of >10 fields/condition per fish. Error bars indicate s.e.m. Mean is shown. Two-tailed unpaired T-test, n=6 Lipofermata-treated fish and n= 6 DMSO-treated fish.

Comment in

  • Sharing Is Caring.
    Xue Q, Roh-Johnson M. Xue Q, et al. Dev Cell. 2019 May 6;49(3):306-307. doi: 10.1016/j.devcel.2019.04.023. Dev Cell. 2019. PMID: 31063747

References

    1. Quail DF, Bowman RL, Akkari L, Quick ML, Schuhmacher AJ, Huse JT, et al. The tumor microenvironment underlies acquired resistance to CSF-1R inhibition in gliomas. Science 2016;352:aad3018. - PMC - PubMed
    1. Tammela T, Sanchez-Rivera FJ, Cetinbas NM, Wu K, Joshi NS, Helenius K, et al. A Wnt-producing niche drives proliferative potential and progression in lung adenocarcinoma. Nature 2017;545:355–9. - PMC - PubMed
    1. Hodi FS, O’Day SJ, McDermott DF, Weber RW, Sosman JA, Haanen JB, et al. Improved survival with ipilimumab in patients with metastatic melanoma. N Engl J Med 2010;363:711–23. - PMC - PubMed
    1. Larkin J, Chiarion-Sileni V, Gonzalez R, Grob JJ, Cowey CL, Lao CD, et al. Combined nivolumab and ipilimumab or monotherapy in untreated melanoma. N Engl J Med 2015;373:23–34. - PMC - PubMed
    1. Tirosh I, Izar B, Prakadan SM, Wadsworth MH, Treacy D, Trombetta JJ, et al. Dissecting the multicellular ecosystem of metastatic melanoma by single-cell RNA-seq. Science 2016;352:189–96. - PMC - PubMed

Publication types

MeSH terms

Substances