. 2018 Jun 14;8(6):434.
doi: 10.3390/nano8060434.

Applications of Nanomaterials Based on Magnetite and Mesoporous Silica on the Selective Detection of Zinc Ion in Live Cell Imaging

Affiliations

Applications of Nanomaterials Based on Magnetite and Mesoporous Silica on the Selective Detection of Zinc Ion in Live Cell Imaging

Roghayeh Sadeghi Erami et al. Nanomaterials (Basel). .

Abstract

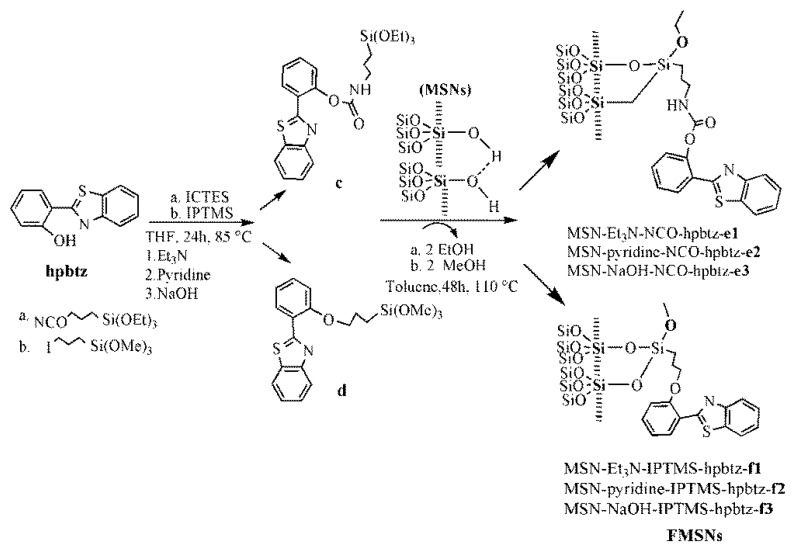
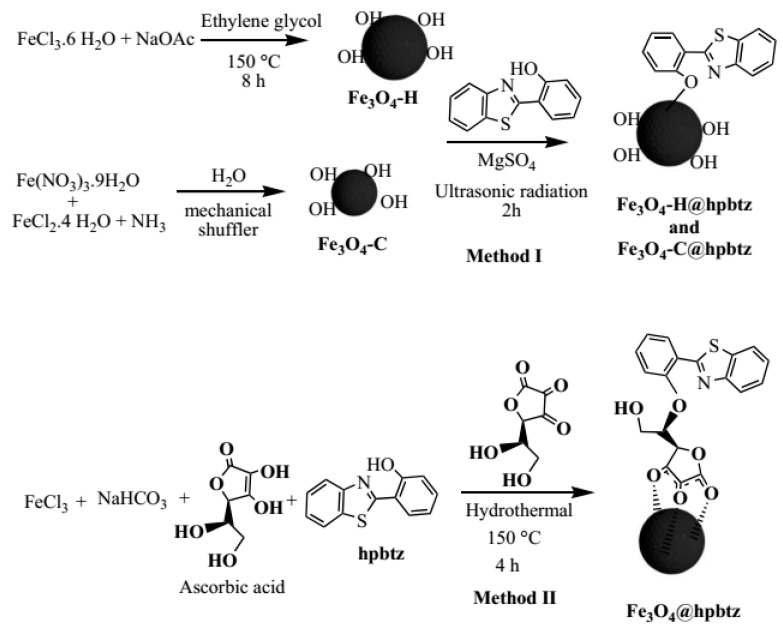
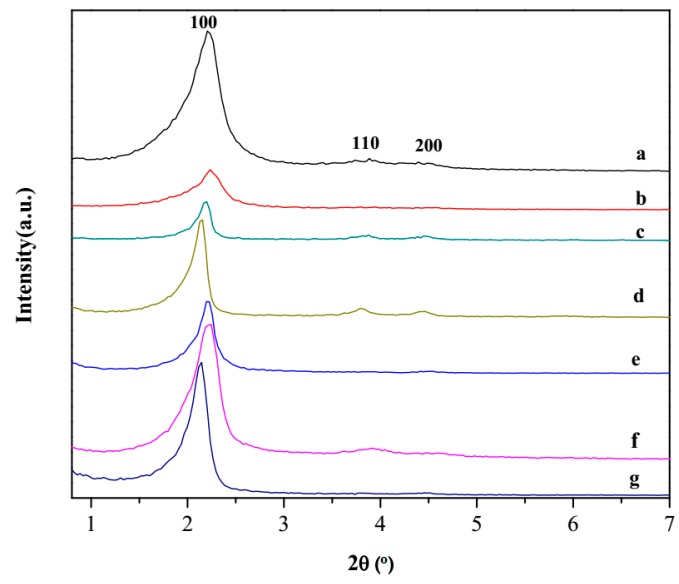
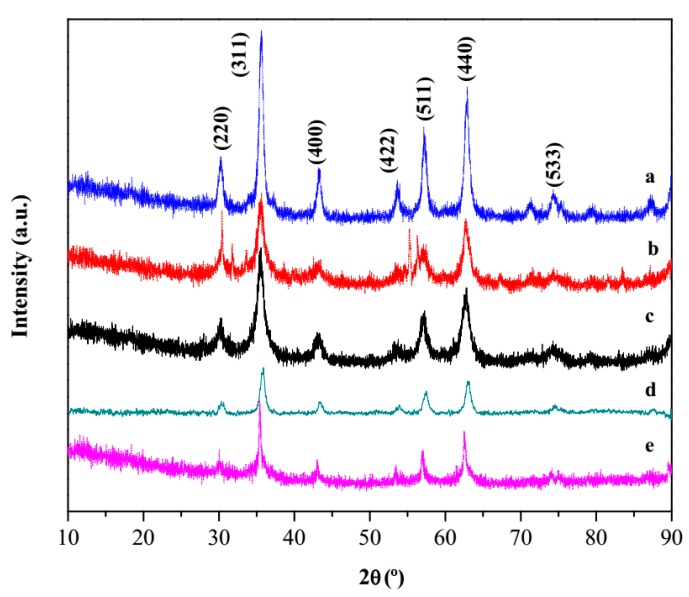
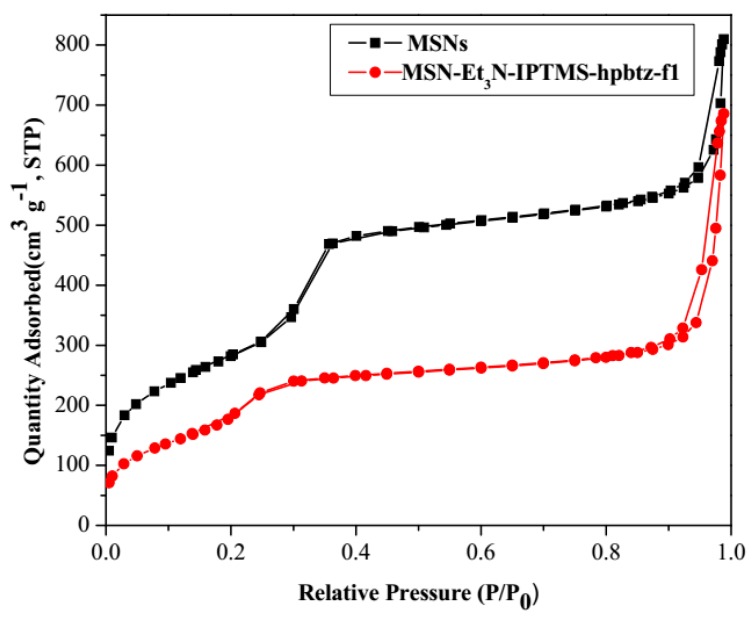
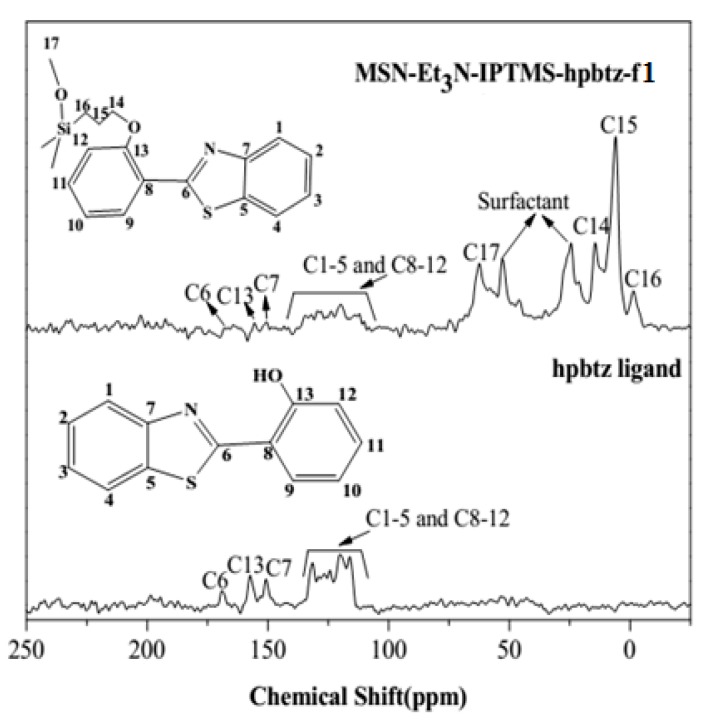
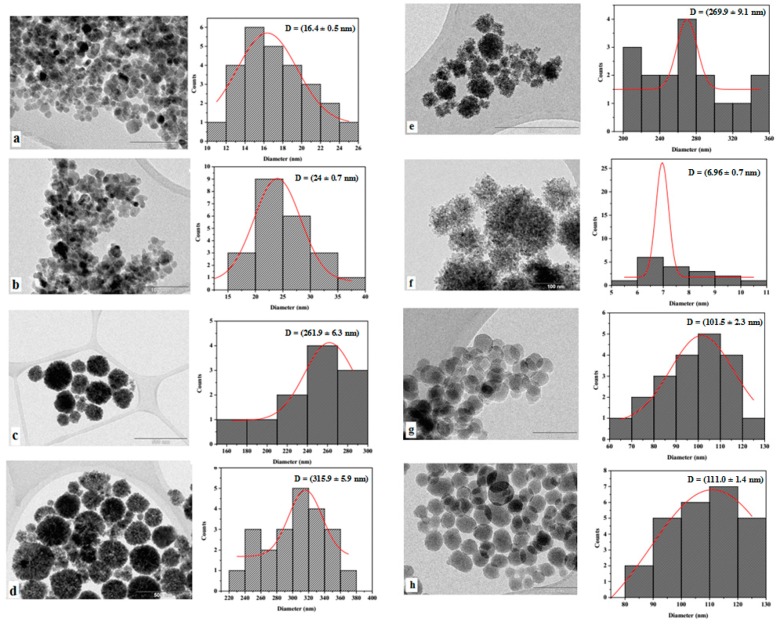
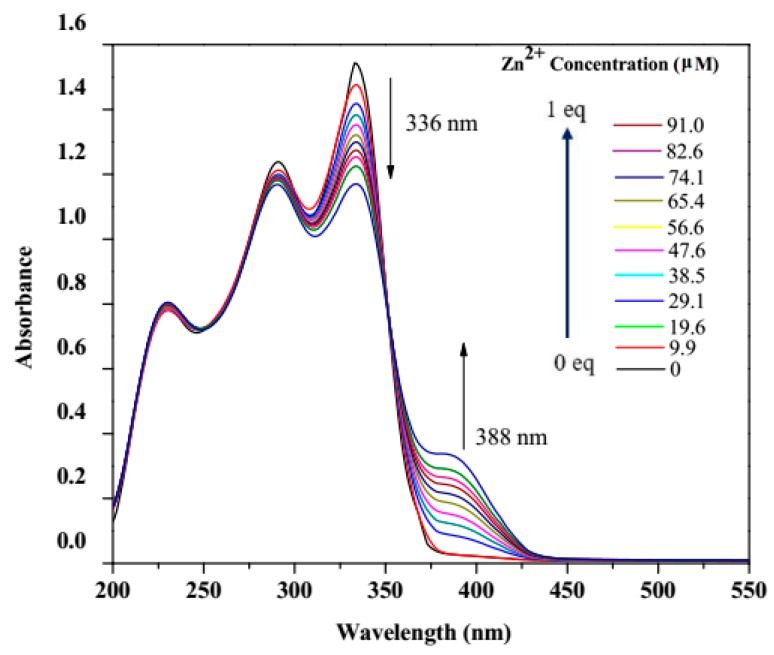
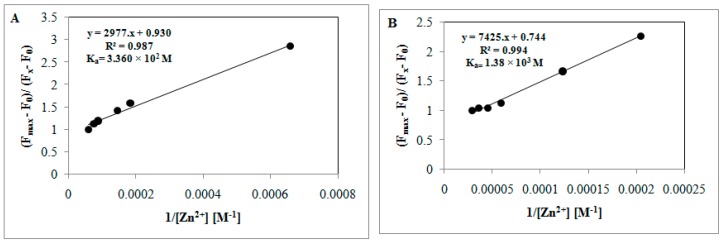
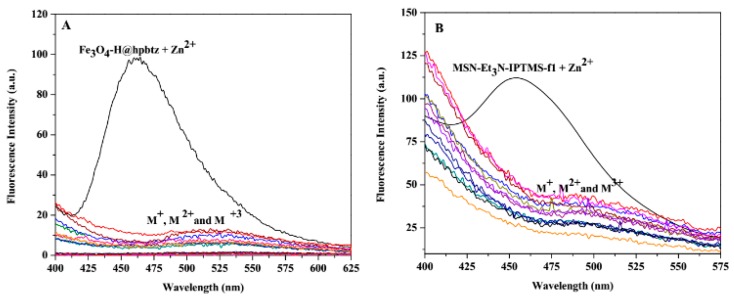
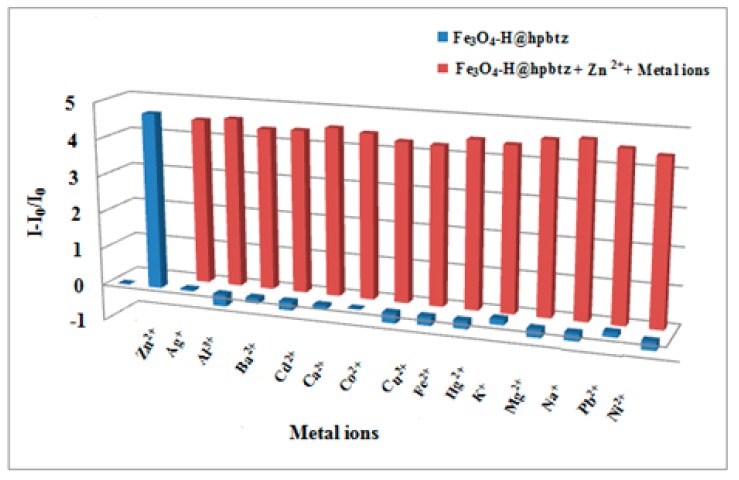
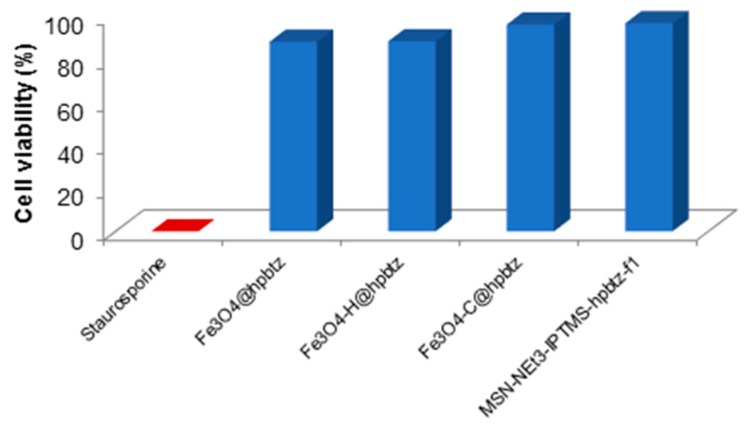
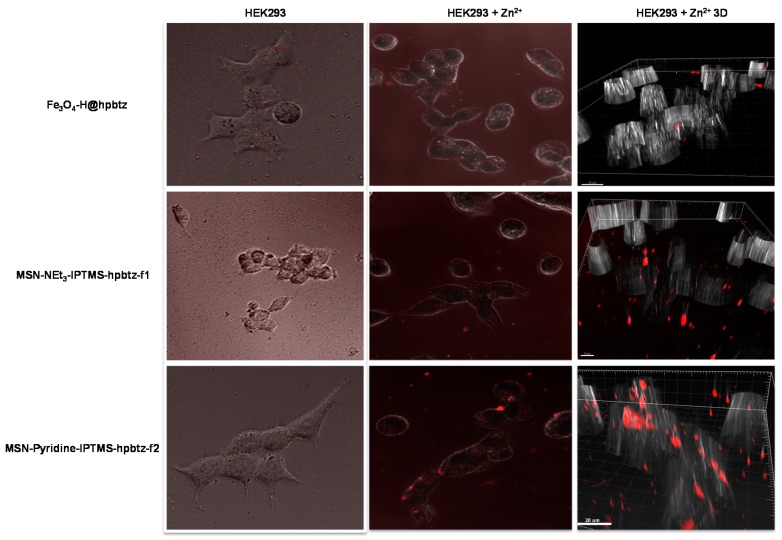
Functionalized magnetite nanoparticles (FMNPs) and functionalized mesoporous silica nanoparticles (FMSNs) were synthesized by the conjugation of magnetite and mesoporous silica with the small and fluorogenic benzothiazole ligand, that is, 2(2-hydroxyphenyl)benzothiazole (hpbtz). The synthesized fluorescent nanoparticles were characterized by FTIR, XRD, XRF, 13C CP MAS NMR, BET, and TEM. The photophysical behavior of FMNPs and FMSNs in ethanol was studied using fluorescence spectroscopy. The modification of magnetite and silica scaffolds with the highly fluorescent benzothiazole ligand enabled the nanoparticles to be used as selective and sensitive optical probes for zinc ion detection. Moreover, the presence of hpbtz in FMNPs and FMSNs induced efficient cell viability and zinc ion uptake, with desirable signaling in the normal human kidney epithelial (Hek293) cell line. The significant viability of FMNPs and FMSNs (80% and 92%, respectively) indicates a potential applicability of these nanoparticles as in vitro imaging agents. The calculated limit of detections (LODs) were found to be 2.53 × 10⁻⁶ and 2.55 × 10⁻⁶ M for Fe₃O₄-H@hpbtz and MSN-Et₃N-IPTMS-hpbtz-f1, respectively. FMSNs showed more pronounced zinc signaling relative to FMNPs, as a result of the more efficient penetration into the cells.

Keywords: Zn2+ detection; Zn2+ sensors; live cell imaging; magnetite; mesoporous silica; nanomaterials.


Conflict of interest statement

The authors declare no conflict of interest.

Figures

Scheme 1
Scheme 1
Synthesis of functionalized mesoporous silica nanoparticles (FMSNs). Reaction of benzothiazole ligand (hpbtz) with 3-isocyanatopropyltriethoxysilane (ICTES) and 3-iodopropyltrimethoxysilane (IPTMS) generates c and d in the presence of different bases. The reaction of the post functionalized materials with ICTES and IPTMS under a nitrogen atmosphere with MSNs, forms the hpbtz loaded materials, e1–e3 and f1–f3, respectively. The resulting products are labeled as MSN-Et3N-IPTMS-hpbtz-f1, MSN-pyridine-IPTMS-hpbtz-f2, MSN-NaOH-IPTMS-hpbtz-f3, MSN-Et3N-NCO-hpbtz-e1, MSN-pyridine-NCO-hpbtz-e2, and MSN-NaOH-NCO-hpbtz-e3.
Scheme 2
Scheme 2
Synthesis of hpbtz-functionalized magnetite nanoparticles (FMNPs) by different methods.
Figure 1
Figure 1
Low angle XRD patterns of (a) MSNs and FMSNs includes the following: (b) MSN-Et3N-IPTMS-hpbtz-f1, (c) MSN-pyridine-IPTMS-hpbtz-f2, (d) MSN-NaOH-IPTMS-hpbtz-f3, (e) MSN-Et3N-NCO-hpbtz-e1, (f) MSN-pyridine-NCO-hpbtz-e2, and (g) MSN-NaOH-NCO-hpbtz-e3.
Figure 2
Figure 2
Wide angle X-Ray powder diffraction (XRD) patterns of (a) Fe3O4-H, (b) Fe3O4-C, (c) Fe3O4-H@hpbtz, (d) Fe3O4-C@hpbtz (prepared in method I), and (e) Fe3O4@hpbtz (prepared in method II).
Figure 3
Figure 3
Nitrogen adsorption/desorption isotherms of MSNs and MSN-Et3N-IPTMS-hpbtz-f1. For both materials, a mixture between type IV and type VI isotherms are exhibited.
Figure 4
Figure 4
Nitrogen adsorption/desorption isotherms of MNPs (Fe3O4-H and Fe3O4-C). For both materials, type III isotherms are exhibited.
Figure 5
Figure 5
13C CP-MAS NMR spectra of hpbtz ligand and MSN-Et3N-IPTMS-hpbtz-f1.
Figure 6
Figure 6
TEM analysis of MNPs and FMNPs for (a) Fe3O4-C, (b) Fe3O4-C@hpbtz, (c) Fe3O4-H, (d) Fe3O4-H@hpbtz, (e) Fe3O4@hpbtz, (f) Fe3O4-H, (g) MSNs, and (h) MSN-Et3N-IPTMS-hpbtz-f1, as well as the corresponding particle size distribution.
Figure 7
Figure 7
UV-vis titration of an ethanolic solution of hpbtz (1 × 10⁻⁴ M) with Zn2+ ion (1 × 10⁻³ M).
Figure 8
Figure 8
Comparative fluorescence spectra of (a) hpbtz, (b) Fe3O4-H@hpbtz, (c) Fe3O4-H@hpbtz + Zn2+, (d) Fe3O4-C@hpbtz, (e) Fe3O4-C@hpbtz + Zn2+, (f) Fe3O4@hpbtz, and (g) Fe3O4@hpbtz + Zn2+, upon the addition of Zn2+ (7.8 equivalent, 300 μL), at a concentration of 10−3 M in an ethanol solution (λex = 350 nm) (Inset: f in higher concentration, 3 mg mL−1).
Figure 9
Figure 9
Comparative fluorescence spectra of (a) MSN-Et3N-IPTMS-hpbtz-f1, (b) MSN-Et3N-IPTMS-hpbtz-f1 + Zn2+, (c) MSN-pyridine-IPTMS-hpbtz-f2, (d) MSN-pyridine-IPTMS-hpbtz-f2 + Zn2+, (e) MSN-NaOH-IPTMS-hpbtz-f3, and (f) MSN-NaOH-IPTMS-hpbtz-f3 + Zn2+, upon the addition of Zn2+ (15.4 equivalent, 350 μL) at a concentration of 10−3 M in ethanol (λex = 305 nm).
Figure 10
Figure 10
Fluorescence intensity changes observed in (A) Fe3O4-H@hpbtz (2 mg mL−1) and (B) MSN-Et3N-IPTMS-hpbtz-f1 (2 mg mL−1) upon the addition of Zn2+ (0–7.8 equivalent, 0–130 μM and 300 μL for A, and 0–15.4 equivalents, 0–130 μM and 350 μL for B) at λex = 350 nm for Aa and 305 nm for B in the ethanol (a and b: plot of the fluorescence intensity at 460 nm as a function of the Zn2+ concentration.
Figure 11
Figure 11
Job’s plot indicating the 2:1 stoichiometry for [Zn2+: Fe3O4-H@hpbtz] (A) and 1:2 for [Zn2+: MSN-Et3N-IPTMS-hpbtz-f1] (B). The total concentration of (L) and Zn2+ is 10 µM (λex = 350 and 305 for Fe3O4-H@hpbtz and MSN-Et3N-IPTMS-hpbtz-f1, respectively).
Figure 12
Figure 12
The association constant (Ka) of each sensor with Zn2+ was calculated by Benesi–Hildebrand equation for Fe3O4-H@hpbtz (A) and MSN-Et3N-IPTMS-hpbtz-f1 (B).
Figure 13
Figure 13
Fluorescence emission spectra for (A) Fe3O4-H@hpbtz in the presence of 7.8 equivalent, 300 μL and (B) MSN-Et3N-IPTMS-hpbtz-f1 in the presence of 15.4 equivalent, 350 μL of various metal ions at λ = 350 and 305 nm, respectively, in ethanol.
Figure 14
Figure 14
Variation of the fluorescence intensity of Fe3O4-H@hpbtz (2 mg mL−1) with Zn2+ (7.8 equivalent, 300 μL) and various metal ions (2 times more in equivalent) at 460 nm (λex= 350 nm) in ethanol.
Figure 15
Figure 15
Variation of the fluorescence intensity of MSN-Et3N-IPTMS-hpbtz-f1 (2 mg mL−1), with Zn2+ (15.4 equivalent, 350 μL) and various metal ions (two times more in equivalent) at 460 nm (λex= 305 nm) in ethanol.
Scheme 3
Scheme 3
Proposed binding mechanism of Fe3O4-H@hpbtz or MSN-Et3N-IPTMS-hpbtz-f1 and Zn2+.
Figure 16
Figure 16
Toxicity of tested nanomaterials on HEK293 cells.
Figure 17
Figure 17
Fluorescence images of the HEK293 cells treated with different functionalized materials in absence of Zn2+ supplementation (Column I), in the presence of supplemented Zn2+ (Column II) and 3D reconstruction of cells treated with nanomaterials in the presence of Zn2+ (Column III).

References

    1. Greenough M.A., Camakaris J., Bush A.I. Metal dyshomeostasis and oxidative stress in Alzheimer’s disease. Neurochem. Int. 2013;62:540–555. doi: 10.1016/j.neuint.2012.08.014. - DOI - PubMed
    1. Guengerich F.P. Thematic Minireview Series: Metals in Biology 2012. J. Biol. Chem. 2012;287:13508–13509. doi: 10.1074/jbc.R112.355933. - DOI - PMC - PubMed
    1. Da Silva J.J.R.F., Williams R.J.P. The Biological Chemistry of the Elements. 2nd ed. Oxford University Press; New York, NY, USA: 2001.
    1. Fukada T., Yamasaki S., Nishida K., Murakami M., Hirano T. Zinc homeostasis and signaling in health and diseases. J. Biol. Inorg. Chem. 2011;16:1123–1134. doi: 10.1007/s00775-011-0797-4. - DOI - PMC - PubMed
    1. Fukada T., Kambe T. Zinc Signals in Cellular Functions and Disorders. Springer; Tokyo, Japan: 2014.

LinkOut - more resources