. 2018 Jun 14;9(1):2337.
doi: 10.1038/s41467-018-04737-0.

Whole-genome resequencing reveals world-wide ancestry and adaptive introgression events of domesticated cattle in East Asia

Affiliations

Whole-genome resequencing reveals world-wide ancestry and adaptive introgression events of domesticated cattle in East Asia

Ningbo Chen et al. Nat Commun. .

Abstract

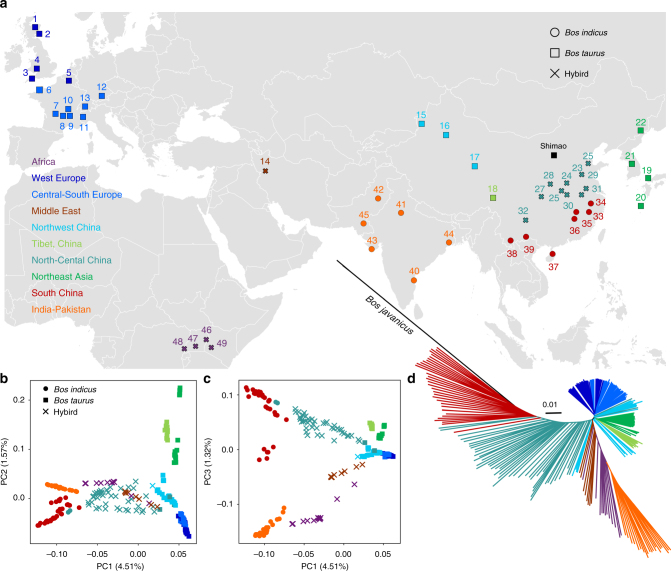
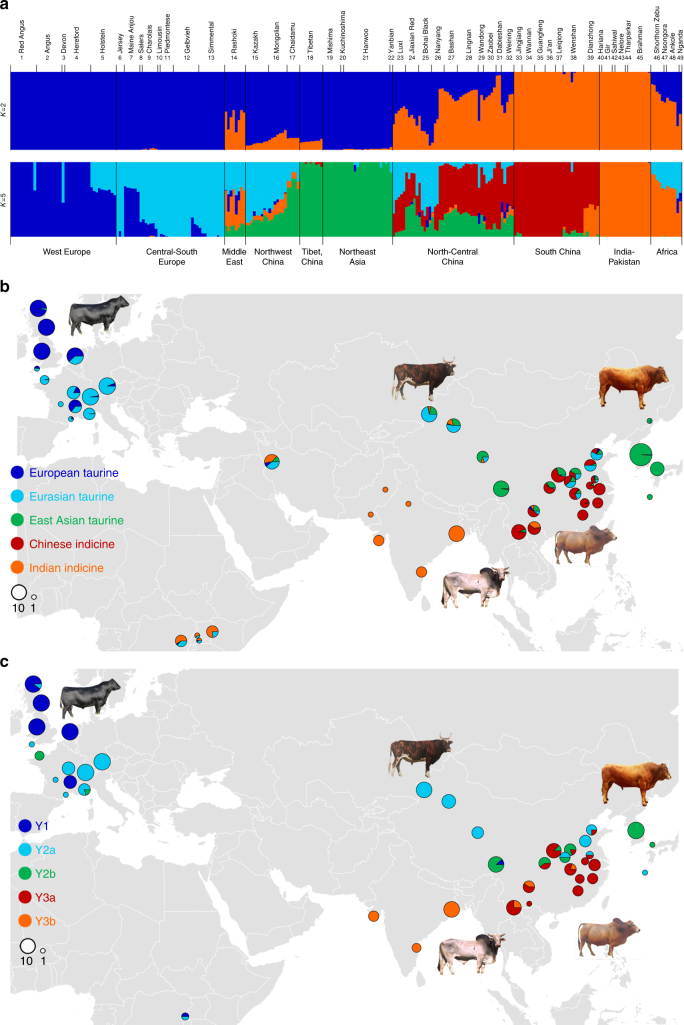
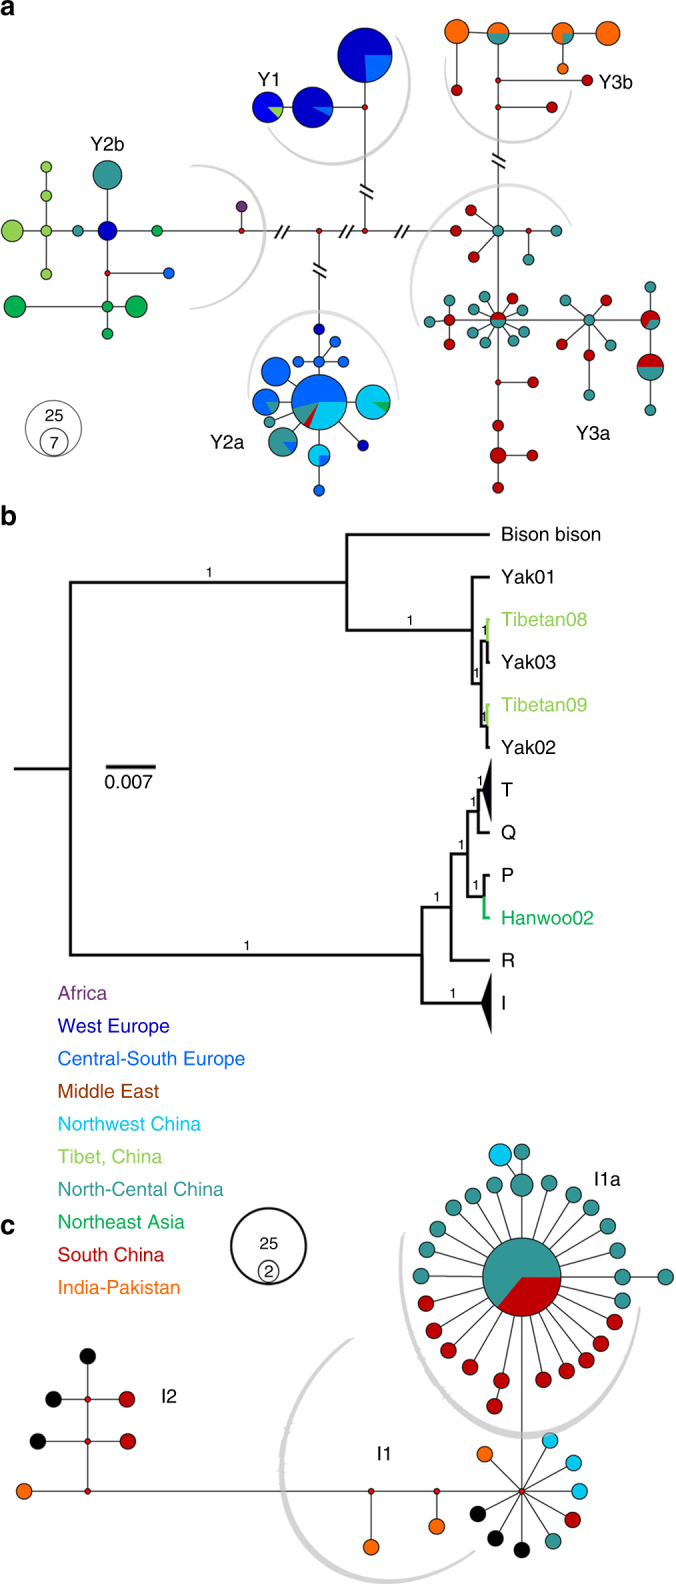
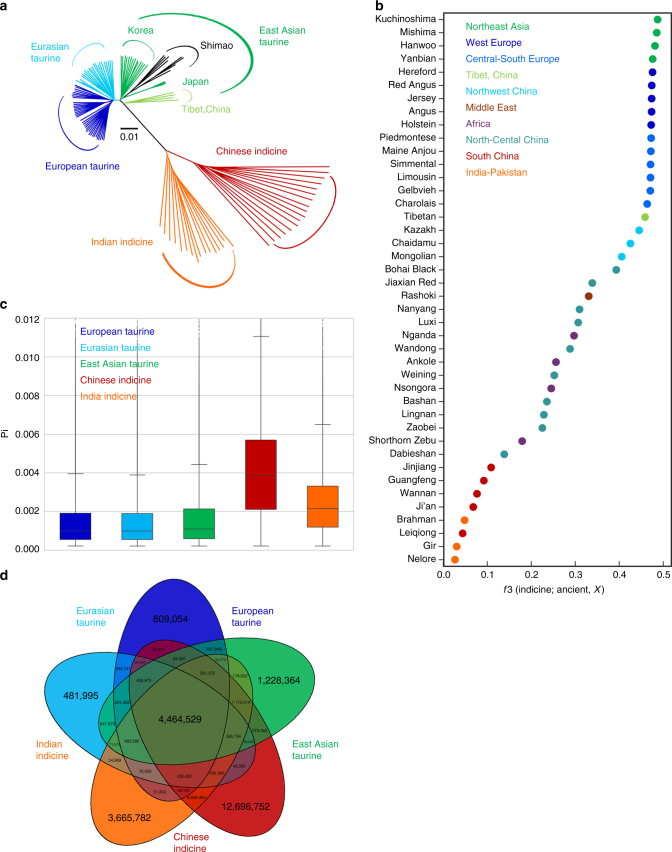
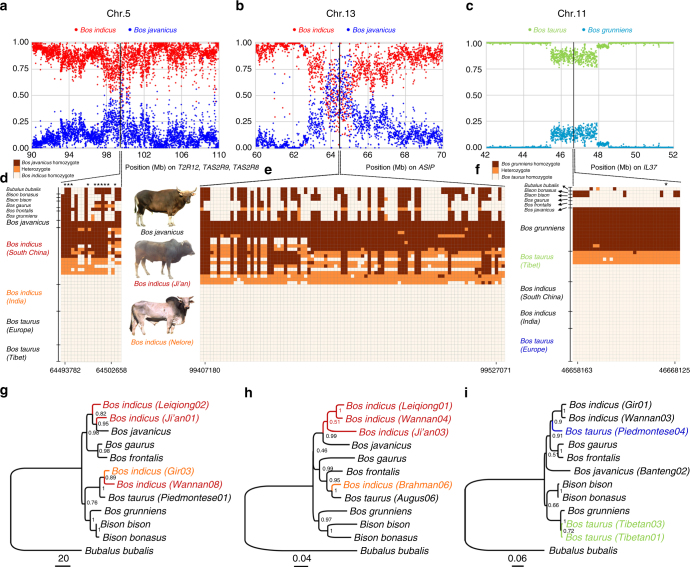
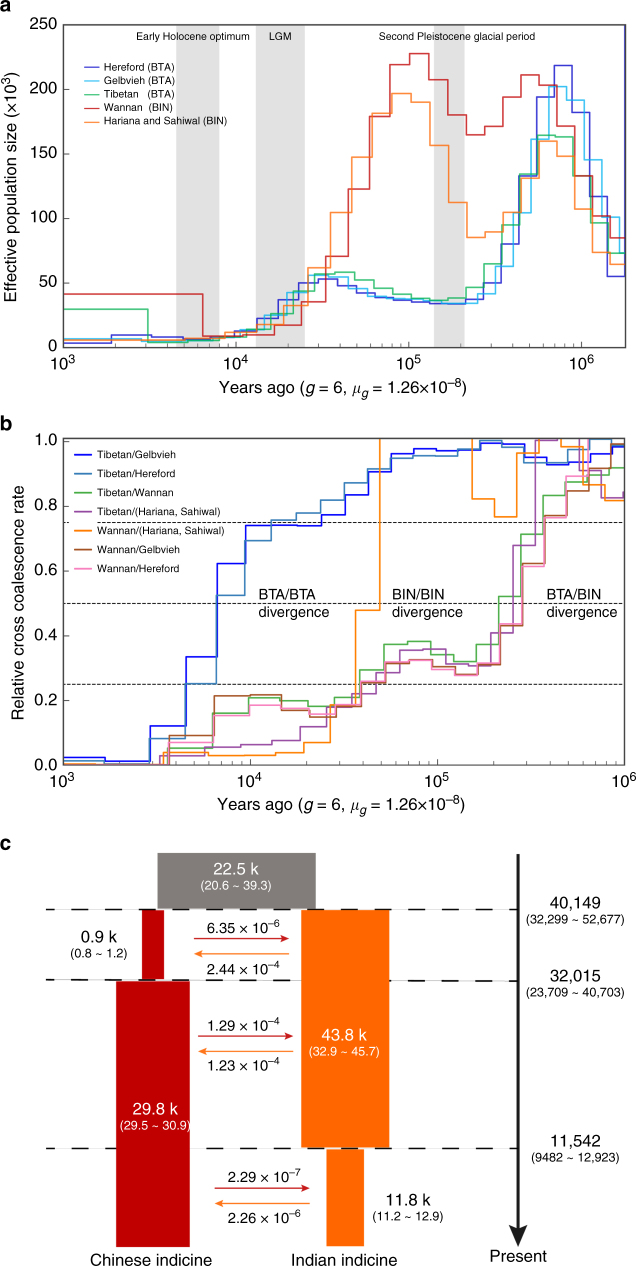
Cattle domestication and the complex histories of East Asian cattle breeds warrant further investigation. Through analysing the genomes of 49 modern breeds and eight East Asian ancient samples, worldwide cattle are consistently classified into five continental groups based on Y-chromosome haplotypes and autosomal variants. We find that East Asian cattle populations are mainly composed of three distinct ancestries, including an earlier East Asian taurine ancestry that reached China at least ~3.9 kya, a later introduced Eurasian taurine ancestry, and a novel Chinese indicine ancestry that diverged from Indian indicine approximately 36.6-49.6 kya. We also report historic introgression events that helped domestic cattle from southern China and the Tibetan Plateau achieve rapid adaptation by acquiring ~2.93% and ~1.22% of their genomes from banteng and yak, respectively. Our findings provide new insights into the evolutionary history of cattle and the importance of introgression in adaptation of cattle to new environmental challenges in East Asia.


Conflict of interest statement

The authors declare no competing interests.

Figures

Fig. 1
Fig. 1
Population structuring and relationship of East Asian cattle. a Geographic map indicating the origins of the cattle breeds in this study. Breed name associated with serial number is listed in Fig. 2a. Principal component analysis (PCA) showing PC1 against PC2 (b) and PC1 against PC3 (c). d A neighbour-joining phylogenetic tree constructed using whole-genome SNP data. The scale bar represents pairwise distances between different individuals. Colours reflect the geographic regions of sampling
Fig. 2
Fig. 2
Autosomal and Y-chromosome evidence for the origin of modern cattle. a Model-based clustering of cattle breeds using ADMIXTURE with K = 5. Breeds are arranged by geographic regions and labelled with serial numbers. b Spatial distribution of five ADMIXTURE coefficients labelled according to geographical maxima. c Y haplogroup distribution of modern cattle. The size of each circle is proportional to the number of samples per breed. Five breeds and their corresponding colour codes are selected to represent the five types of ancestry and haplogroup
Fig. 3
Fig. 3
Y-chromosome haplogroup and phylogeny of complete mitogenomes from modern cattle. a Median-joining (MJ) network of Y-chromosome haplotypes using 745 SNPs. b Rooted maximum-likelihood phylogenetic tree detailing the relationships among all available bovine haplogroups of I, P, Q, R and T mitogenomes, an American bison mitogenome and three yak mitogenomes. c MJ network of mitogenomes from Bos indicus. The black line and circle in b and c represent published reference sequences, respectively
Fig. 4
Fig. 4
Relationship of ancient Chinese cattle to present-day cattle and genetic diversity of the five “core” cattle groups. a Neighbour-joining tree of the relationship between the ancient Chinese cattle and five “core” groups. The scale bar represents the pairwise distances between different individuals. b Shared drift with ancient Shimao cattle in 42 modern-day cattle populations using the outgroup-f3 statistics (Indicine cattle; Ancient, X). The indicine cattle include three individuals of Hariana, Sahiwal and Tharparkar cattle. c Genome-wide distribution of nucleotide diversity of five “core” cattle groups in 50-kb non-overlapping windows. The horizontal line inside the box corresponds to the median of this distribution, the bottom and top of the box are the first and third quartiles. Data points outside the whiskers can be considered as outliers. d Venn diagram showing unique and shared SNPs among the five “core” cattle groups
Fig. 5
Fig. 5
Phylogenetic analyses of SNP data confirm the Bos javanicus introgression into Chinese indicine cattle or the yak introgression into Tibetan taurine cattle. a, b Bos javanicus introgression plots constructed based on whole-genome sequencing data from two representative segments on chromosomes 5 and 13. The relative frequencies of Bos indicus-specific alleles are in red dots while Bos javanicus-specific alleles in blue dots. Bos javanicus-specific alternate alleles were identified as those that appeared in Bos javanicus genomes and were absent from taurine and Indian indicine cattle genomes. c Yak introgression plots constructed based on whole-genome sequencing data from a reprehensive segment on chromosome 11. The yak-specific alleles were identified using the same method. The relative frequencies of Bos taurus-specific are in green dots while Bos grunniens-specific are in sky blue. Vertical mouldings in df represent the SNP regions on chromosomes 5, 13 and 11 used for neighbour-joining (NJ) phylogeny analysis. The patterns of high-frequency SNPs at the T2R12, TAS2R9 and TAS2R6 regions are shown in d, at the ASIP region in e and at the IL-37 region in f. The star (*) denotes non-synonymous SNPs. Nucleotides with brown box in d and e represent Bos javanicus-specific homozygote genotypes, and with orange box represent heterozygote genotypes. Nucleotides with brown box in f represent Bos grunniens-specific homozygote genotypes. NJ phylogeny of 12 haplotypes supporting the introgression of banteng into Chinese indicine cattle (g, h) and the introgression of yak into Tibetan taurine cattle (i). The reliability of the tree branches (shown at the nodes) is tested with 1000 bootstrap replicates
Fig. 6
Fig. 6
Coalescence-based inference of demographic history of cattle using MSMC and ∂a∂i. a Population size history inference of Bos taurus (BTA) and Bos indicus (BIN) lineages based on four haplotypes each from high-coverage European taurine (Hereford), Eurasian taurine (Gelbvieh), East Asian taurine (Tibetan), Chinese indicine (Wannan) and Indian indicine (Hariana and Sahiwal) individuals. The large grey-shaded boxes illustrate the Early Holocene Optimum, the last glacial maximum (LGM), and the second Pleistocene Glacial Period. b Inferred relative cross-coalescence rates between pairs of populations over time based on four haplotypes each from Hereford, Gelbvieh, Tibetan, Wannan and Indian breeds (Hariana and Sahiwal). The x-axis shows time and the y-axis a measure of similarity for each pair of compared populations. c ∂a∂i result showing the divergence time of Chinese indicine and Indian indicine cattle. The ancestral population is in grey, Chinese indicine cattle is in red and Indian indicine cattle is in orange. The width shows the relative effective population size. The figures at the arrows indicate the average number of migrants per generation between Chinese indicine and Indian indicine cattle

References

    1. National Bureau of Statistics. China Statistical Yearbook 2016 (China Statistics Press, Beijing, 2016).
    1. Vigne JD, Peters J, Helmer D. The First Steps of Animal Domestication. Oxford: Oxbow Books; 2005.
    1. Loftus RT, MacHugh DE, Bradley DG, Sharp PM, Cunningham P. Evidence for two independent domestications of cattle. Proc. Natl Acad. Sci. USA. 1994;91:2757–2761. doi: 10.1073/pnas.91.7.2757. - DOI - PMC - PubMed
    1. McTavish EJ, Decker JE, Schnabel RD, Taylor JF, Hillis DM. New World cattle show ancestry from multiple independent domestication events. Proc. Natl Acad. Sci. USA. 2013;110:E1398–E1406. doi: 10.1073/pnas.1303367110. - DOI - PMC - PubMed
    1. The Bovine HapMap Consortium. Genome-wide survey of SNP variation uncovers the genetic structure of cattle breeds. Science324, 528 (2009). - PMC - PubMed

Publication types

LinkOut - more resources