. 2018 Jun 14;8(1):9106.
doi: 10.1038/s41598-018-27509-8.

Metabarcoding analysis on European coastal samples reveals new molecular metazoan diversity

Affiliations

Metabarcoding analysis on European coastal samples reveals new molecular metazoan diversity

David López-Escardó et al. Sci Rep. .

Abstract

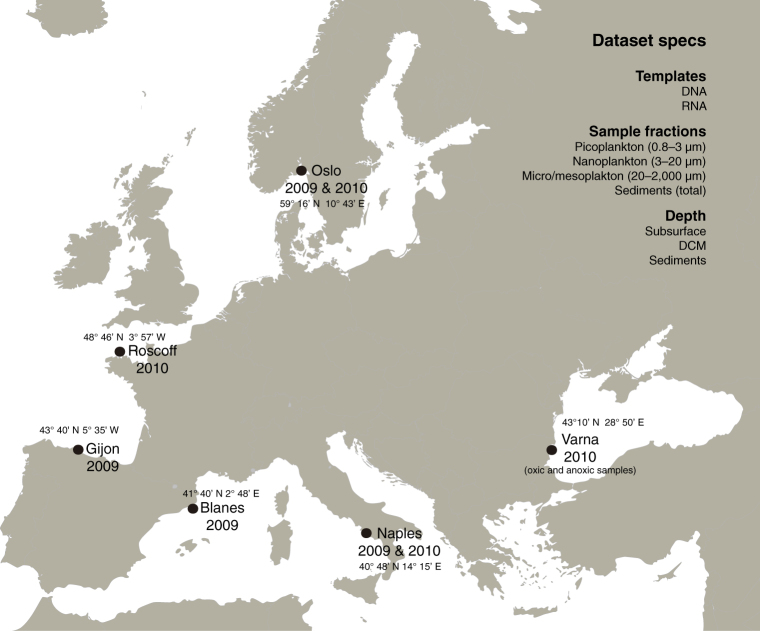
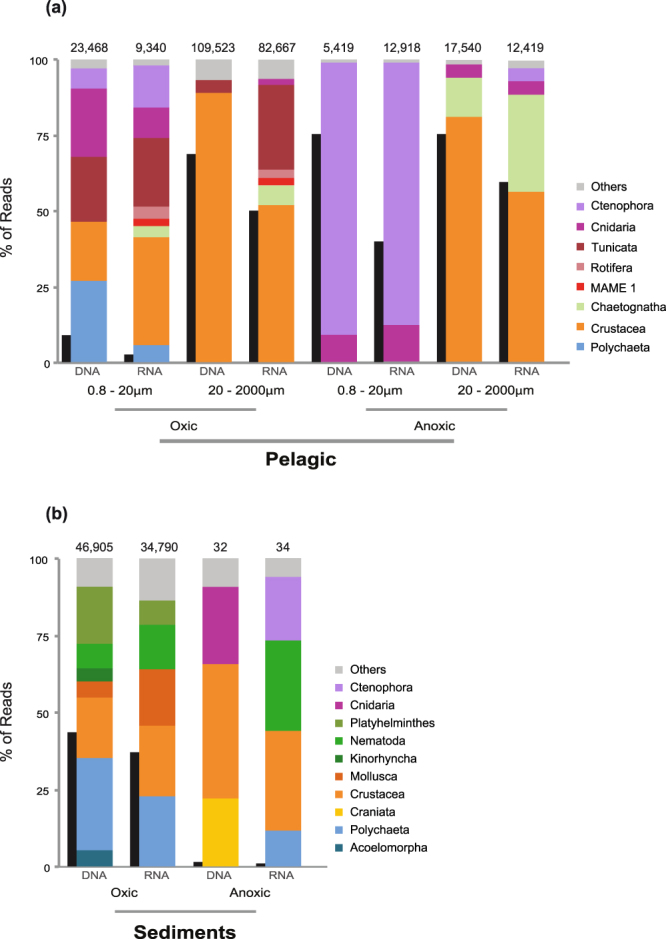
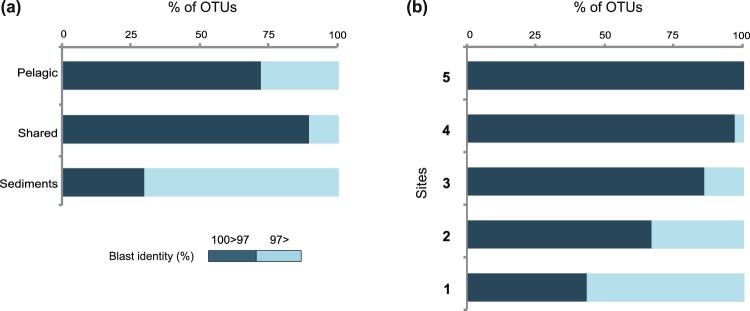
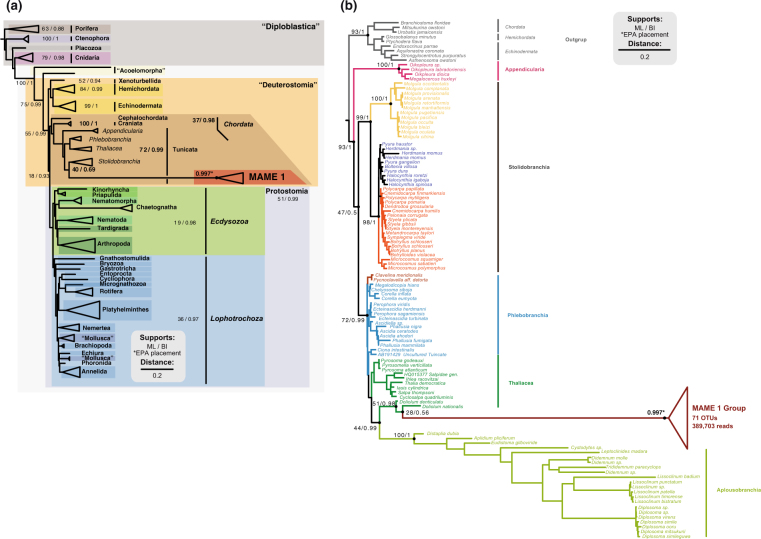
Although animals are among the best studied organisms, we still lack a full description of their diversity, especially for microscopic taxa. This is partly due to the time-consuming and costly nature of surveying animal diversity through morphological and molecular studies of individual taxa. A powerful alternative is the use of high-throughput environmental sequencing, providing molecular data from all organisms sampled. We here address the unknown diversity of animal phyla in marine environments using an extensive dataset designed to assess eukaryotic ribosomal diversity among European coastal locations. A multi-phylum assessment of marine animal diversity that includes water column and sediments, oxic and anoxic environments, and both DNA and RNA templates, revealed a high percentage of novel 18S rRNA sequences in most phyla, suggesting that marine environments have not yet been fully sampled at a molecular level. This novelty is especially high among Platyhelminthes, Acoelomorpha, and Nematoda, which are well studied from a morphological perspective and abundant in benthic environments. We also identified, based on molecular data, a potentially novel group of widespread tunicates. Moreover, we recovered a high number of reads for Ctenophora and Cnidaria in the smaller fractions suggesting their gametes might play a greater ecological role than previously suspected.


Conflict of interest statement

The authors declare no competing interests.

Figures

Figure 1
Figure 1
BioMarKs sampling sites. Map indicating the sampling locations where the data were collected and the summary of the dataset characteristics. Map retrieved from Wikimedia Commons (https://commons.wikimedia.org/wiki/File:Blank_map_Europe_without_borders.png) CC-BY-SA-4.0,3.0,2.5,2.0,1.0 (https://creativecommons.org/licenses/by-sa/4.0/).
Figure 2
Figure 2
Relative abundances of different metazoan groups and metazoan relative abundance compared to the eukaryotes. Relative abundances of different metazoan groups (colored columns) and metazoan relative abundance compared to total eukaryotes (black columns) in (a) pelagic and (b) benthic samples (sediments) separated by oxygen availability and by template (source DNA or RNA). Pelagic data is divided also by size fraction. The number above each column represents the total number of metazoan reads present dataset.
Figure 3
Figure 3
Metazoan richness. (a) OTU distribution for each metazoan group divided into pelagic specific, sediment specific and those present in both environments. The number on the right shows the total number of OTUs in each dataset. (b) Taxonomical distribution of the OTUs classified according to their occurrence in 1 or more (up to 5) geographical sites. It is also included the environmental distribution of OTUs based on prevalence: In blue, pelagic-specific OTUs (i.e., OTU with more than 90% of the reads within the water column); in green, OTUs present both in the water column and the sediments; in brown, OTUs present only in sediments (i.e., OTUs with more than 90% of the reads within the sediments). The number of OTUs (blue line) and number of reads (red line) based on their occurrence in 1 or more (up to 5) geographical site is shown to the right.
Figure 4
Figure 4
Analysis of the small (pico and nano) and large (micro/meso) fractions, and extracellular DNA. (a) Taxonomic distribution of the OTU reads in the smaller and larger fractions and within the extracellular DNA. (b) Ratio of the numbers of reads from the smaller fractions and large fraction for these OTUs.
Figure 5
Figure 5
Sequence novelty plus summary of OTUs/read numbers of the main metazoan phyla in our dataset. (a) Distribution of OTU BLAST identities against NCBI nt nr for the main phyla of our dataset. (b) Summary of the number of OTUs (blue) and the number of reads (red) of the given phyla.
Figure 6
Figure 6
Sequence novelty regarding environmental and occurrence of different OTUs. Distribution of OTU BLAST identities against NCBI nt nr, in the OTUs classified by (a) environment (OTUs exclusively pelagic, benthc or present at both habitats) or (b) occurrence in different sites (OTUs present in one or up to 5 geographical sites).
Figure 7
Figure 7
Worldwide distribution of MAME 1 group. World map within BioMarks data or within public repositories. Dot size represents the number of reads found shown on a log2 scale. Bar charts show the distribution of MAME 1 reads by depth and fraction.
Figure 8
Figure 8
18S rRNA phylogenetic trees placing the novel metazoan group MAME 1. The trees were inferred using the NCBI long sequence KC582969 as a representative of MAME 1 group. The nodal support values marked with a dot correspond to maximum likelihood 100-replicate bootstrap support and Bayesian posterior probabilities. The other 69 MAME 1 OTUs were placed to the group by the RAxML-EPA algorithm. The asterisk indicates that all MAME 1 OTU’s were placed with the MAME 1 sequence with an average likelihood on of 0.997 in both trees. In (a) the phylogenetic inference of MAME 1 within Metazoa. Metazoan super-group nomenclature is based on Paps et al. 2009a and b,. On the other hand (b) show its phylogenetic position within tunicates using the sequences from Tsagkogeorga et al..

References

    1. del Campo J, et al. The others: our biased perspective of eukaryotic genomes. Trends Ecol. Evol. 2014;29:252–259. doi: 10.1016/j.tree.2014.03.006. - DOI - PMC - PubMed
    1. Zhang Z-Q. Animal biodiversity: An update of classification and diversity in 2013. Zootaxa. 2013;3703:5–11. doi: 10.11646/zootaxa.3703.1.3. - DOI - PubMed
    1. Blaxter ML, et al. Defining operational taxonomic units using DNA barcode data. Philos. Trans. R. Soc. B Biol. Sci. 2005;360:1935–1943. doi: 10.1098/rstb.2005.1725. - DOI - PMC - PubMed
    1. Guil, N. In Biogeography of Microscopic Organisms (ed. Fontaneto, D.) 284–306 (Cambridge University Press, 2011).
    1. Snelgrove PVR. Getting to the Bottom of Marine Biodiversity: Sedimentary Habitats. Bioscience. 1999;49:129–138. doi: 10.2307/1313538. - DOI

Publication types

LinkOut - more resources