. 2018 Jun 14;8(1):9117.
doi: 10.1038/s41598-018-27294-4.

Temporal and spectral EEG dynamics can be indicators of stealth placement

Affiliations

Temporal and spectral EEG dynamics can be indicators of stealth placement

Regina W Y Wang et al. Sci Rep. .

Abstract

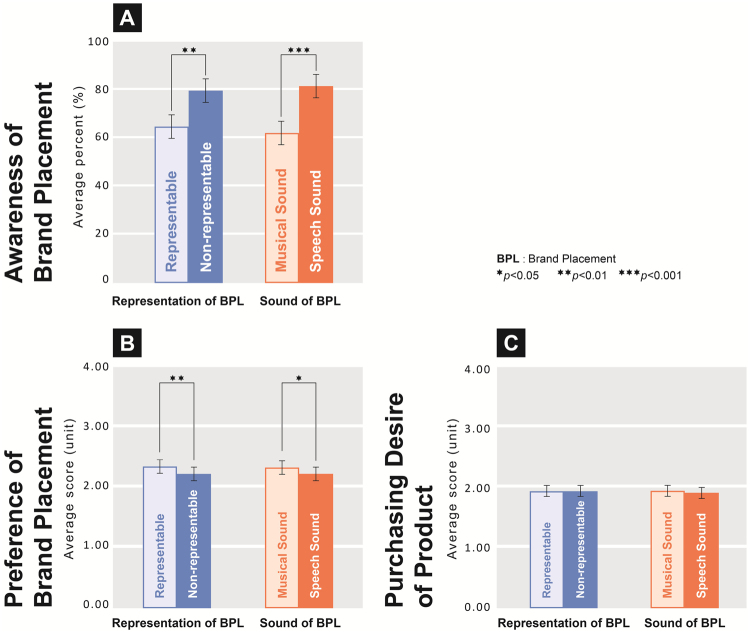
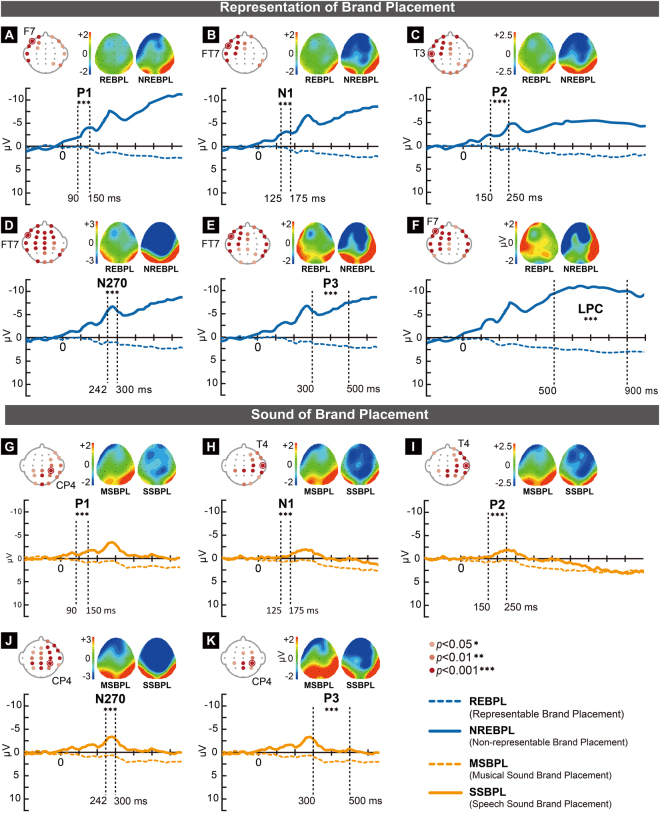
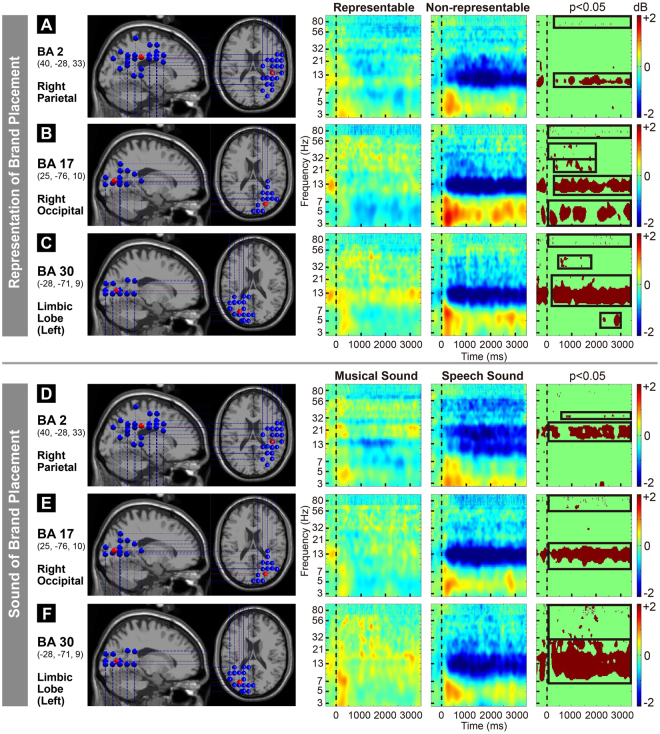
Stealth placement marketing, where consumers are unaware that they are being marketed to, attempts to reduce the audiences' resistance to traditional persuasive advertising. It is a form of advertising that involves targeted exposure of brands or products incorporated in other works, usually with or without explicit reference to the brands or products. Brand placement can be presented in different visual and auditory forms in video programs. The present study proposed that different 'representations' (i.e., representable or non-representable) and 'sounds' (i.e., speech or musical sound) of brand placement can affect the viewers' perception of the brand. Event-related potential results indicated significant differences in P1, N1, P2, N270, and P3. Further, event-related spectral perturbation results indicated significant differences in theta, alpha, beta, and gamma (30-100 Hz), in the right parietal, right occipital area, and limbic lobe. 'Non-representable' or 'speech sound' brand placement induced significant temporal and spectral EEG dynamics in viewers.


Conflict of interest statement

The authors declare no competing interests.

Figures

Figure 1
Figure 1
(A) Design of the experimental stimuli. A 2 × 2 framework was used to examine the effects of the interaction between representable/non-representable and speech/musical sounds on brand placement. The 4 types of stimulus condition were as follows: (1) ‘representable versus speech sound’ brand placement, (2) ‘non-representable versus speech sound’ brand placement, (3) ‘representable versus musical sound’ brand placement, and (4) ‘non-representable versus musical sound’ brand placement. (B) The experimental procedure first involved the presentation of a behavioural cue before the stimulus video, followed by a ‘+’ fixation point for 1,000 ms and a stimulus video for 25,000 ms. The behavioural questions were then presented; the participants controlled the timing. The experimental process for one stimulus video is presented here. The entire experiment, which included 48 trials and 105 stimuli, lasted for approximately 35 min.
Figure 2
Figure 2
Behavioural results indicated that the two factors of brand placement led to significant differences in awareness, preference, and purchasing desire. (A) Under the NREBPL condition, awareness of SSBPL was significantly higher than that of MSBPL (p < 0.001). (B) Under the SSBPL condition, awareness of NREBPL was significantly higher than that of REBPL (p < 0.001). (C) Preference of the REBPL condition was significantly higher than that of NREBPL (p < 0.001); preference of the MSBPL condition was significantly higher than that of SSBPL (p < 0.05). (D) There was no significant difference in purchasing desire between the REBPL and NREBPL conditions (p > 0.05), and between the MSBPL and SSBPL conditions (p > 0.05).
Figure 3
Figure 3
(AK) Significant electrode maps, brain heat maps, and maximum average amplitude of event-related potential (ERP) components with significant differences in representation and sound of brand placement. ☉ indicates significant electrodes in the ERP waveform (p < 0.001). (AF) show the significant electrode maps of P1, N1, P2, N270, P3, and LPC, with significant differences in the different representations of brand placement. (A) For the ERP component P1 at electrode F7, the maximum average amplitude of REBPL was higher than that of NREBPL (p < 0.001). (B) For the ERP component P1 at electrode FT7, the maximum average amplitude of NREBPL was higher than that of REBPL (p < 0.001). (C) For the ERP component P2 at electrode T3, the maximum average amplitude of REBPL was higher than that of NREBPL (p < 0.001). (D) For the ERP component N270 at electrode FT7, the maximum average amplitude of NREBPL was higher than that of REBPL (p < 0.001). (E) For the ERP component P3 at electrode FT7, the maximum average amplitude of REBPL was higher than that of NREBPL (p < 0.001). (F) For the ERP component LPC at electrode F7, the maximum average amplitude of REBPL was higher than that of NREBPL (p < 0.001). (GK) show significant electrode maps for P1, N1, P2, N270, and P3, with significant differences for different sounds of brand placement. (G) For the ERP component P1 at electrode CP4, the maximum average amplitude of MSBPL was higher than that of SSBPL (p < 0.001). (H) For the ERP component N1 at electrode T4, the maximum average amplitude of SSBPL was higher than that of MSBPL (p < 0.001). (I) For the ERP component P2 at electrode T4, the maximum average amplitude of MSBPL was higher than that of SSBPL (p < 0.001). (J) For the ERP component N270 at electrode CP4, the maximum average amplitude of SSBPL was higher than that of MSBPL (p < 0.001). (K) For the ERP component P3 at electrode CP4, the maximum average amplitude of MSBPL was higher than that of SSBPL (p < 0.001).
Figure 4
Figure 4
Independent component analysis was performed on the electroencephalography signals of all the participants to obtain the statistically significant scalp map and equivalent dipole for clustering, which resulted in 12 brain areas. The figures show the scalp map and equivalent dipole of the 12 brain areas. *Indicates that the ERSP analysis revealed significant differences in these brain regions for the two factors (different representations and sounds of brand placement; p < 0.05), which include the right parietal area (BA 2), right occipital area (BA 17), and limbic lobe (BA 30). Parametric testing with FDR correction was performed for significance testing (p < 0.05) to further compare the differences for the varying representations and sounds at different frequencies (Fig. 5).
Figure 5
Figure 5
Event-related spectral perturbation (ERSP) results of the 25 participants for different brand placement representations and sounds. False discovery rate analysis was performed for significance testing. (AC) Brain regions and ERSP(s) results are shown, with significant differences between REBPL and NREBPL. The two factors indicate significant differences in the spectral powers of theta, alpha, beta, and gamma for Brodmann areas BA 2, BA 17, and BA 30 (p < 0.05). (A) In BA 2, REBPL shows a higher spectral power for 7–13 Hz (alpha) than NREBPL (p < 0.05), and NREBPL shows a higher spectral power for 80–100 Hz (high gamma) than REBPL (p < 0.05). (B) In BA 17, NREBPL shows a higher spectral power for 3–6 Hz (theta) than REBPL (p < 0.05); REBPL shows a higher spectral power for 9–20 Hz (alpha, beta) than NREBPL (p < 0.05); REBPL shows a higher spectral power for 20–30 Hz (beta) than NREBPL (p < 0.05); REBPL shows a higher spectral power for 30–60 Hz (low gamma) than NREBPL (p < 0.05); and NREBPL shows a higher spectral power for 60–100 Hz (high gamma) than REBPL (p < 0.05). (C) In BA 30, NREBPL shows a higher spectral power for 4–6 Hz (theta) than REBPL (p < 0.05); REBPL shows a higher spectral power for 9–20 Hz (alpha, beta) than NREBPL (p < 0.05); REBPL shows a higher spectral power for 30–40 Hz (low gamma) than NREBPL (p < 0.05); and NREBPL shows a higher spectral power for 60–100 Hz (high gamma) than REBPL (p < 0.05). (DF) Brain regions and ERSP(s) results are shown, with significant differences between SSBPL and MSBPL. The two factors indicate significant differences in the spectral powers of alpha, beta, and gamma for Brodmann areas BA 2, BA 17, and BA 30 (p < 0.05). (D) In BA 2, MSBPL shows a higher spectral power for 15–15 Hz (beta) than SSBPL (p < 0.05), and MSBPL shows a higher spectral power for 30–40 Hz (low gamma) than SSBPL (p < 0.05). (E) In BA 17, MSBPL shows a higher spectral power for 10–20 Hz (alpha, beta) than SSBPL (p < 0.05), and MSBPL shows a higher spectral power for 60–100 Hz (high gamma) than SSBPL (p < 0.05). (F) In BA 30, MSBPL shows a higher spectral power for 7–30 Hz (alpha, beta) than SSBPL (p < 0.05), and MSBPL shows a higher spectral power for 30–100 Hz (low gamma, high gamma) than SSBPL (p < 0.05).

Similar articles

Cited by

References

    1. Silver MA, Ress D, Heeger DJ. Topographic maps of visual spatial attention in human parietal cortex. Journal of neurophysiology. 2005;94:1358–1371. doi: 10.1152/jn.01316.2004. - DOI - PMC - PubMed
    1. Vecchiato G, et al. Spectral EEG frontal asymmetries correlate with the experienced pleasantness of TV commercial advertisements. Medical & biological engineering & computing. 2011;49:579–583. doi: 10.1007/s11517-011-0747-x. - DOI - PubMed
    1. Azevedo, P. C. B. S. d. Perception of commercial brands and the emotional and social value: A spatiotemporal EEG analysis. (2010).
    1. Ohme R, Reykowska D, Wiener D, Choromanska A. Analysis of neurophysiological reactions to advertising stimuli by means of EEG and galvanic skin response measures. Journal of Neuroscience, Psychology, and Economics. 2009;2:21. doi: 10.1037/a0015462. - DOI
    1. Astolfi, L. et al. The track of brain activity during the observation of tv commercials with the high-resolution eeg technology. Computational intelligence and neuroscience2009 (2009). - PMC - PubMed

Publication types

LinkOut - more resources