. 2018 Jun 14;8(1):9127.
doi: 10.1038/s41598-018-27501-2.

LncRNA expression profiling of BMSCs in osteonecrosis of the femoral head associated with increased adipogenic and decreased osteogenic differentiation

Affiliations

LncRNA expression profiling of BMSCs in osteonecrosis of the femoral head associated with increased adipogenic and decreased osteogenic differentiation

Qingyu Wang et al. Sci Rep. .

Abstract

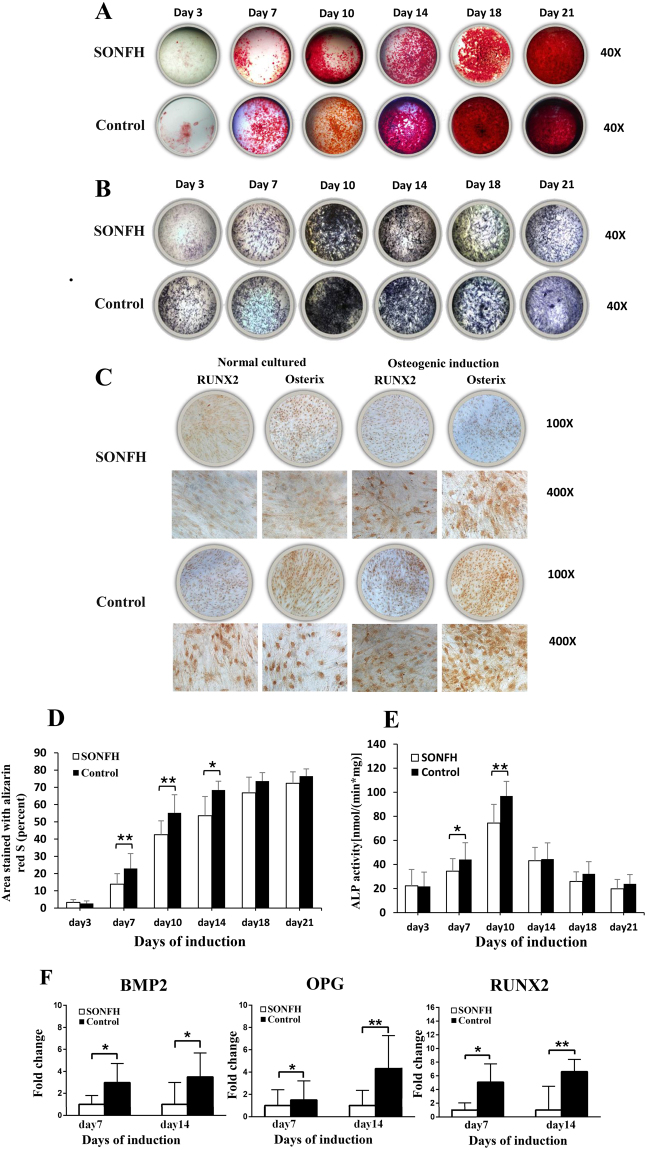
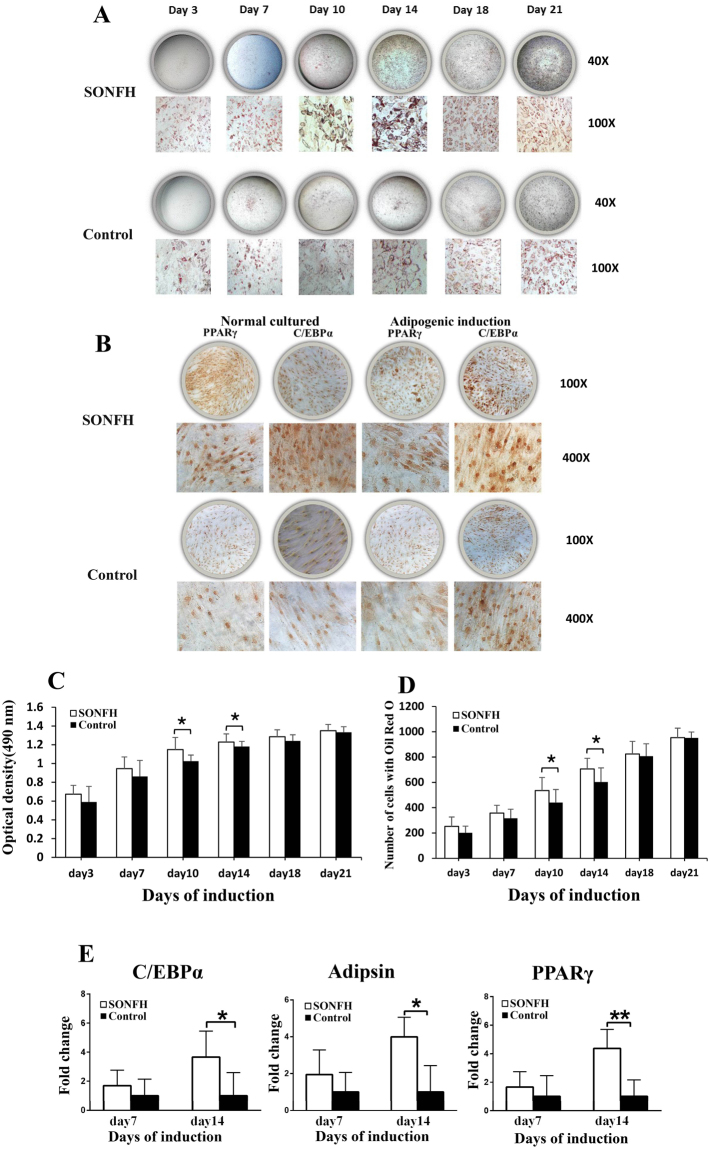
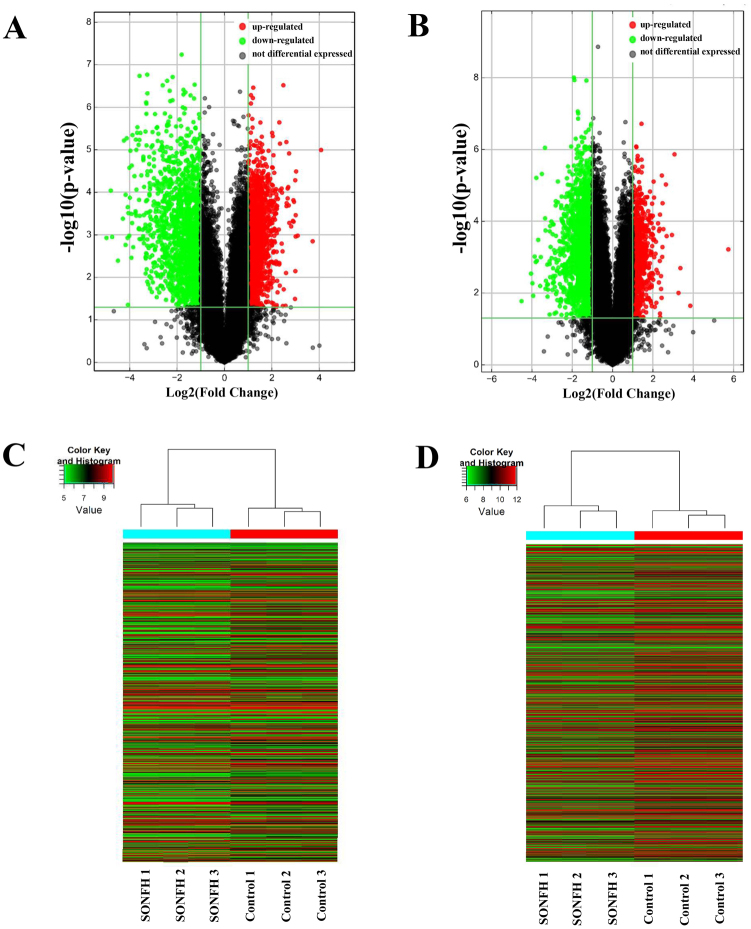
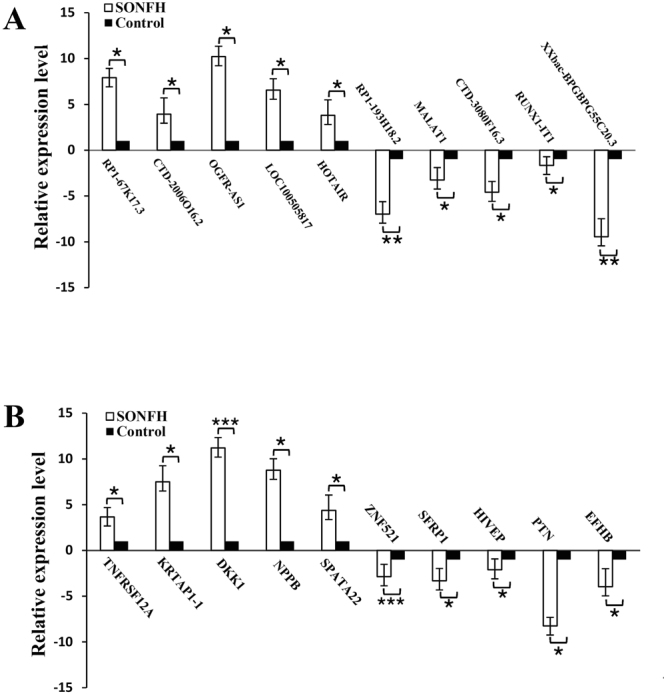
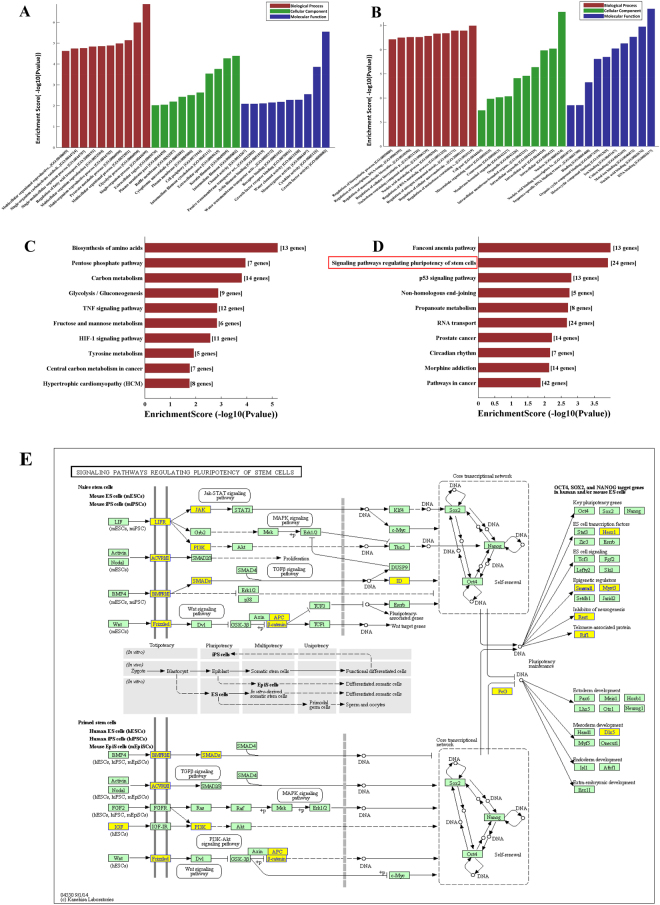
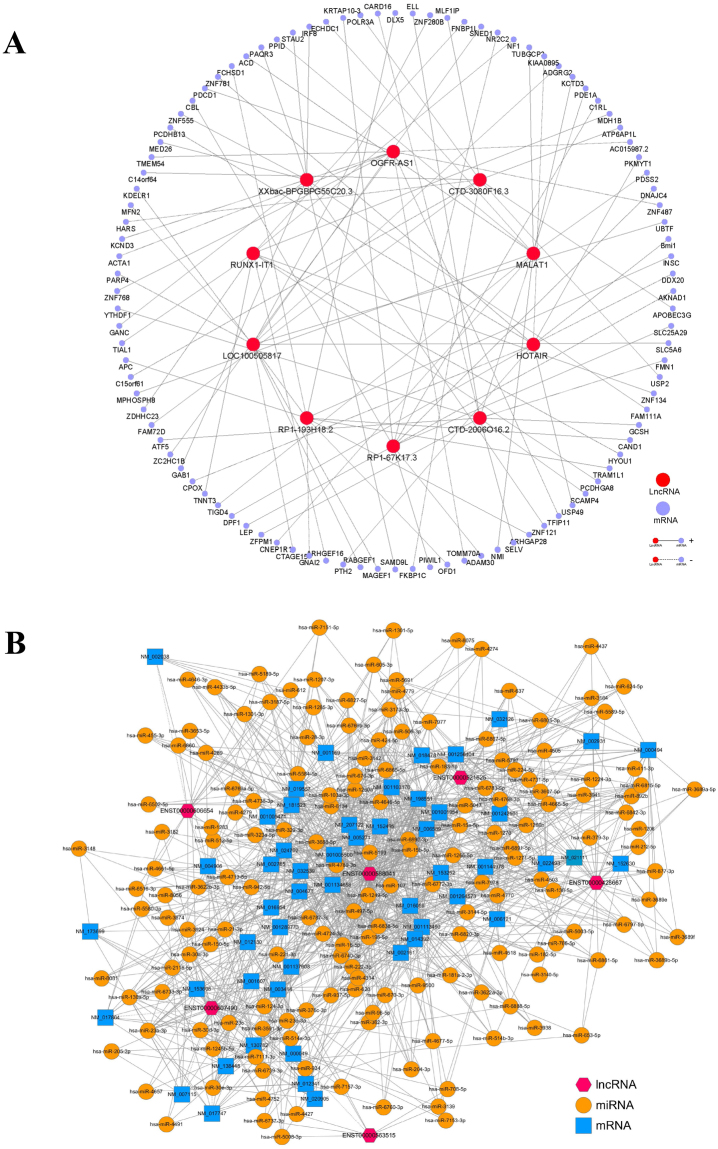
Long noncoding RNAs (lncRNAs) are critical gene expression regulators and are involved in several bone diseases. To explore the potential roles of lncRNAs in osteonecrosis of the femoral head (ONFH), we investigated for the first time the lncRNA expression profile of bone marrow mesenchymal stem cells (BMSCs) from patients with steroid-induced ONFH (SONFH) with microarray and bioinformatics analysis. A total of 1878 lncRNAs and 838 mRNAs were significantly up-regulated while 1842 lncRNAs and 1937 mRNAs were statistically down-regulated in the SONFH group compared with control group. The results validated by qRT-PCR were consistent with the microarray profiling data, especially involved in upregulation and downregulation of critical lncRNAs as well as mRNAs expression related to adipogenic and osteogenic differentiation. Pathway analyses revealed 40 signaling pathways with significant differences, especially the signaling pathways to regulate stem cell pluripotency. The CNC and ceRNA network indicated that lncRNA RP1-193H18.2, MALAT1 and HOTAIR were associated with abnormal osteogenic and adipogenic differentiation of BMSCs in the patients with SONFH. Our results suggest the lncRNA expression profiles were closely associated with the abnormal adipogenic and osteogenic transdifferentiation of BMSCs during the development of SONFH and explore a new insight into the molecular mechanisms of SONFH.


Conflict of interest statement

The authors declare no competing interests.

Figures

Figure 1
Figure 1
The osteogenic differentiation ability of BMSCs between the SONFH (n = 16) and control groups (n = 16). The SONFH group had weaker ARS (A) and ALP (B) staining (40×) than the control group. (C) The SONFH group showed weaker RUNX2 and Osterix immunohistochemical staining. (D) The proportion of ARS-stained areas quantified in the SONFH group was significantly lower than that of control group at day 7, 10 and 14. (E) The ALP activity of the SONFH group was significantly decreased compared to that of the control group at days 7 and 10. (F) The expression levels of BMP2, OPG and RUNX2 during osteogenic differentiation of BMSCs in the SONFH group were significantly decreased comparing to the control group. All samples were normalized to the expression of GAPDH, and the relative expression levels of each gene were analyzed using the 2−△△Ct method. *P < 0.05, **P < 0.01.
Figure 2
Figure 2
The adipogenic differentiation ability of BMSCs between the SONFH (n = 16) and control groups (n = 16). (A) The SONFH group had stronger Oil Red O staining (40× and 200×) than the control group. (B) For immunohistochemical staining of adipogenic markers (PPARγ, C/EBPα), the SONFH group had stronger staining than the control group. (C) The Oil Red O quantification of SONFH group was significantly higher than that of the control group at day 10 and 14. (D) The number of cells with Oil Red O staining (100×) in SONFH group was significantly higher than control group at day10 and day 14. (E) The expression levels of PPARγ, C/EBPα and Adipsin during adipogenic differentiation of BMSCs in the SONFH group were significantly increased comparing to the control group. All samples were normalized to the expression of GAPDH, and the relative expression levels of each gene were analyzed using the 2−△△Ct method. *P < 0.05, **P < 0.01.
Figure 3
Figure 3
Overview of aberrantly expressed lncRNAs and mRNAs in SONFH. (A,B) The Volcano Plot of lncRNA and mRNA expression. Each point represented one lncRNA or one mRNA. The red points (up-regulated) and green points (down-regulated) indicated a change in lncRNA or mRNA expression of more than 2.0-fold. (C,D) Hierarchical clustering showed a distinguishable lncRNA or mRNA expression profile between the two groups and homogeneity within groups. Each row represented an lncRNA or mRNA and each column represented a sample. Red color represented a high relative expression level; green color represented a low relative expression levels. RNA was extracted from the BMSCs of three SONFH patients and three control patients.
Figure 4
Figure 4
Validation of the lncRNA and mRNA microarray results by real-time qPCR. LncRNA(A) and mRNA(B) microarray results were verified by real-time qPCR between the SONFH group (n = 12) and the control group (n = 12). All samples were normalized to the expression of GAPDH, and the relative expression levels of each gene were analyzed using the 2−△△Ct method. *P < 0.05, **P < 0.01 and ***P < 0.001.
Figure 5
Figure 5
GO and pathway analysis of differentially expressed mRNAs. The GO analysis covered the three domains biological process, cellular component and molecular function. (A,B) Enriched up-regulated and down-regulated GO terms for each of the categories. (C,D) Significantly up-regulated and down-regulated pathways. (E) The signaling pathways regulating the pluripotency of stem cells. A total of 24 differentially expressed gene were enrich in this pathway category which included Jak-STAT, MAPK, TGFβ, Wnt and PI3K- Akt signaling pathways. The genes in the yellow boxes were down-regulated and the genes in the green boxes showed no change in expression.
Figure 6
Figure 6
The CNC and ceRNA network. (A) For the CNC network, the lines represented the regulatory relationships between genes (solid lines represened positive correlations, dotted lines represened negative correlations). Nodes in light blue were mRNAs. Nodes in red were lncRNAs. (B) For the ceRNA network, nodes in yellow were microRNAs. Nodes in light blue were mRNAs. Nodes in magenta were lncRNAs.

Similar articles

Cited by

References

    1. Mont MA, Cherian JJ, Sierra RJ, Jones LC, Lieberman JR. Nontraumatic Osteonecrosis of the Femoral Head: Where Do We Stand Today? A Ten-Year Update. J Bone Joint Surg Am. 2015;97:1604–1627. doi: 10.2106/JBJS.O.00071. - DOI - PubMed
    1. Moya-Angeler J, Gianakos AL, Villa JC, Ni A, Lane JM. Current concepts on osteonecrosis of the femoral head. World J Orthop. 2015;6:590–601. doi: 10.5312/wjo.v6.i8.590. - DOI - PMC - PubMed
    1. Al-Jabri T, et al. The role of electrical stimulation in the management of avascular necrosis of the femoral head in adults: a systematic review. BMC Musculoskelet Disord. 2017;18:319. doi: 10.1186/s12891-017-1663-5. - DOI - PMC - PubMed
    1. Zhang Y, et al. Association of ABCB1 C3435T polymorphism with the susceptibility to osteonecrosis of the femoral head: A meta-analysis. Medicine (Baltimore) 2017;96:e6049. doi: 10.1097/MD.0000000000006049. - DOI - PMC - PubMed
    1. Chinese Guideline for the Diagnosis and Treatment of Osteonecrosis of the Femoral Head in Adults, Orthop Surg 9 3–12, 10.1111/os.12302 (2017). - PMC - PubMed

Publication types

LinkOut - more resources