. 2018 Jun 14;8(1):9119.
doi: 10.1038/s41598-018-27353-w.

Pharmacological activation of epidermal growth factor receptor signaling inhibits colitis-associated cancer in mice

Affiliations

Pharmacological activation of epidermal growth factor receptor signaling inhibits colitis-associated cancer in mice

Philip E Dubé et al. Sci Rep. .

Abstract

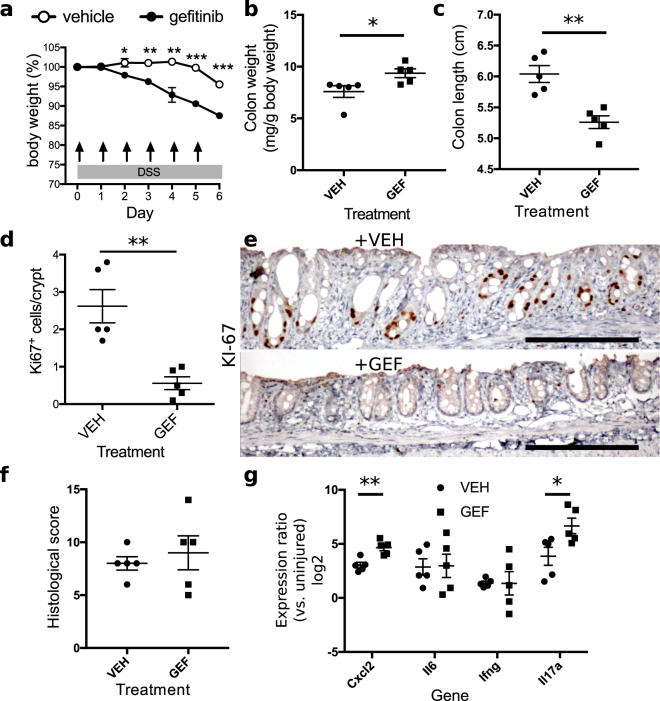
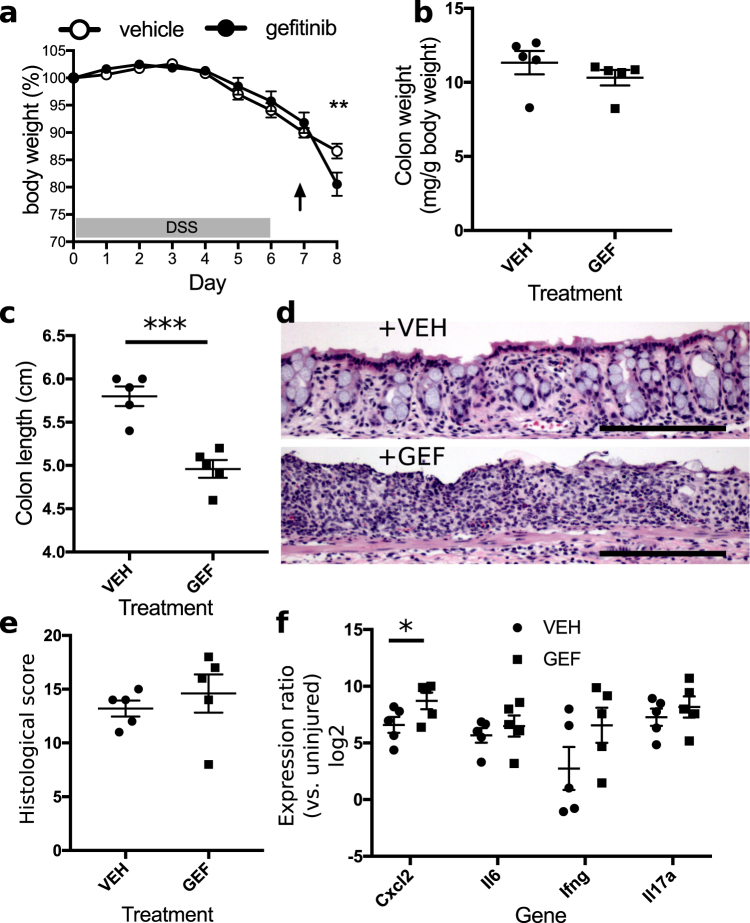
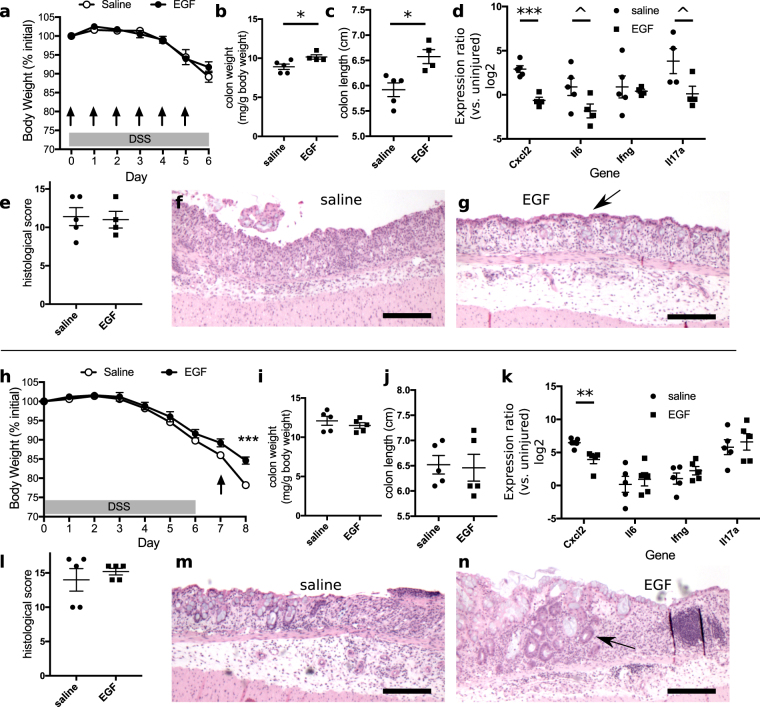
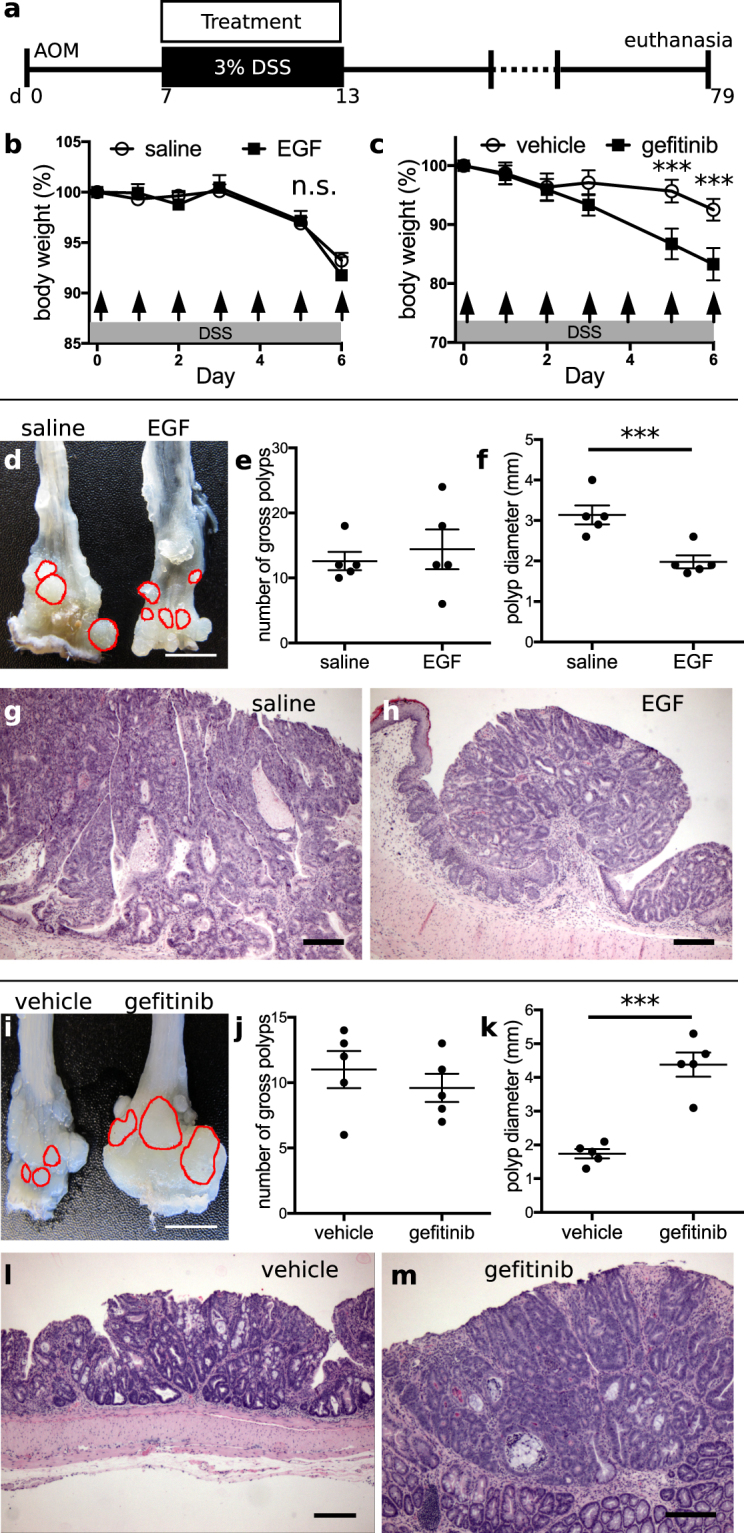
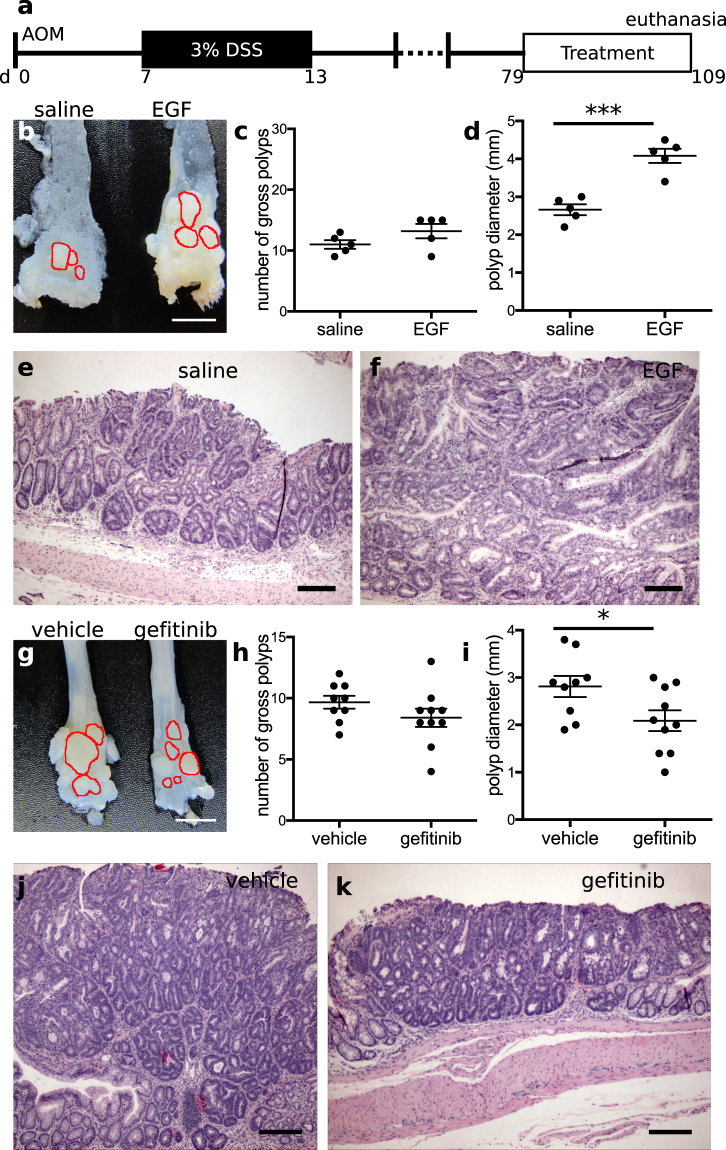
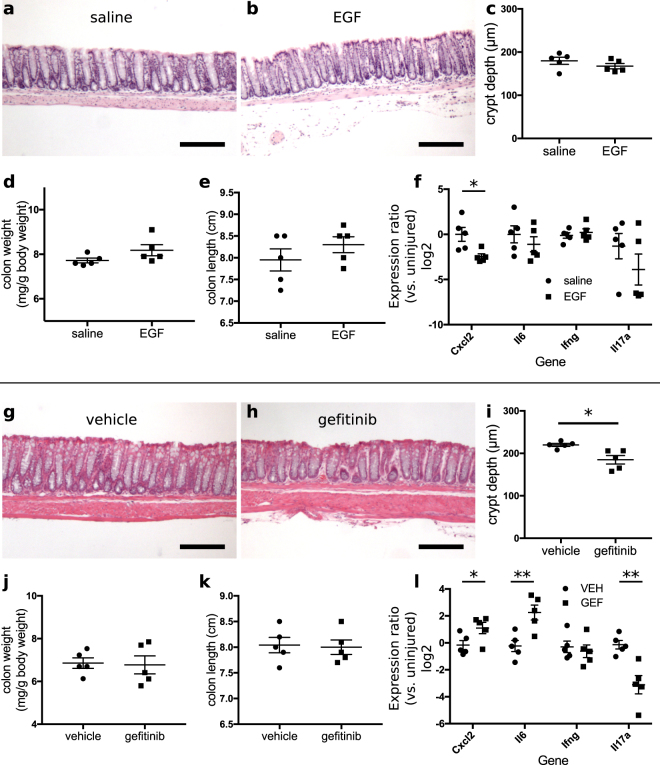
Current treatments for inflammatory bowel disease (IBD) target the overactive immune response of the intestinal mucosa. However, epidermal growth factor (EGF), an activating ligand of the EGF receptor (EGFR), has been shown to induce disease remission through direct targeting of intestinal mucosal healing. Despite promising preclinical and clinical results, this EGFR-activating therapy has not progressed, in part due to the potential for carcinogenesis associated with long-term use and the increased risk of colitis-associated cancer (CAC) in IBD. Here we tested whether pharmacological modulation of EGFR altered outcomes of CAC in the murine azoxymethane/dextran sulfate sodium model. We found that administering EGF during the period of maximum colitis severity ("early"), coincident with the initiation and early promotion of tumors, improved outcomes of colitis and reduced tumor size. In contrast, daily EGF administration beginning ~2 months after tumor initiation ("late") increased tumor size. Administration of the EGFR kinase inhibitor gefitinib increased the tumor size when the drug was given early and decreased the tumor size when the drug was administered late. EGF administration not only reduced colonic cytokine and chemokine expression during injury, but also baseline chemokine expression in homeostasis. These results suggest that EGFR activation during acute bouts of colitis may reduce the long-term burden of CAC.


Conflict of interest statement

The authors declare no competing interests.

Figures

Figure 1
Figure 1
Inhibition of EGFR kinase activity exacerbates colonic mucosal injury. (a) Concomitant gavage of mice with 200 mg/kg/d gefitinib and 3% DSS administration leads to accelerated weight loss, which was apparent by day 2, in gefitinib-treated animals compared to vehicle-treated controls. Arrows denote days in which a single daily dose of vehicle or gefitinib was administered (n = 5 mice per group). (b,c) Gefitinib (GEF) treatment increased colonic weight (b) and decreased colonic length (c), compared to vehicle (VEH) treatment. These changes correlate with increased injury. (d,e) Gefitinib (GEF) reduced the number (d) of proliferating, KI-67+ epithelial cells, as illustrated in representative stainings (e) comparing vehicle (VEH)- and gefitinib (GEF)-treated samples (stained KI-67 is brown with counterstained blue hematoxylin). Images were acquired at 100× magnification. (f) No differences between samples were observed in histological score at day 6. (g) Gefitinib treatment elevated colonic mRNA expression levels of Cxcl2 and Il17a cytokines (day 6). *p < 0.05; **p < 0.01; ***p < 0.001. Summary statistics: mean ± s.e.m. Scale bars: 200 µm.
Figure 2
Figure 2
EGFR inhibition impairs mucosal recovery from colitis. (a) Administration of 200 mg/kg gefitinib after completion of a 6-day-treatment of 3% DSS resulted in severe body weight loss. The arrow denotes the day in which a single dose of vehicle or gefitinib was administered (n = 5 mice per group). (b,c) Colonic weights on day 8 were unchanged between mice treated with gefitinib (GEF) or vehicle (VEH) (b), but colonic length was reduced in gefitinib-treated samples (c). (d) Representative hematoxylin and eosin (H&E)-stained sections of injured colon demonstrated increased crypt loss associated with gefinitib (GEF) treatment versus vehicle (VEH). Images were acquired at 40× magnification. (e) There was no change in histological score between groups. (f) Cxcl2 expression increased in gefitinib (GEF)-treated samples. *p < 0.05; **p < 0.01; ***p < 0.001. Summary statistics: mean ± s.e.m. Scale bars: 200 µm.
Figure 3
Figure 3
EGF treatment improves outcomes of DSS colitis. (a) Simultaneous oral DSS administration and daily intraperitoneal injection of 1 µg EGF did not alter body weight loss compared to saline-injected controls. The arrows indicate the days in which daily doses of saline or EGF were injected. (b,c) Both colonic weight (b) and length (c) were increased by EGF treatment, supporting trophic activity of EGF in the context of injury. (d) EGF injection for 6 d resulted in decreased expression of proinflammatory colonic cytokines Cxcl2, Il6, and Il17a. (e) There were no discernible differences in overall colonic histological score in mice treated with EGF or saline. (f,g) H&E-stained sections demonstrate that saline-treated samples (f) exhibited qualitatively greater ulceration than EGF-treated samples (g). The arrow indicates surviving surface epithelial cells in EGF-treated samples. Images were acquired at 40× magnification. (h) In contrast to treatment with EGF during DSS exposure, intraperitoneal 1 µg EGF injection after DSS withdrawal limited further body weight loss. (i,j) No differences in colon weight (i) or colon length (j) were observed between EGF and saline-treated specimens. (k) The EGF-treated group exhibited decreased colonic Cxcl2 expression on day 8. (l) Overall histological scores did not differ between treatment groups. (m,n) H&E-stained sections of colons from saline-treated animals demonstrated ulceration and crypt loss (m). Similar characteristics were observed in colons from EGF-treated mice (n). However, groups of regenerative crypt structures (arrow) were noted in all of the EGF-treated samples (n). Images were acquired at 40× magnification. ^p < 0.1; *p < 0.05; **p < 0.01; ***p < 0.001. Summary statistics: mean ± s.e.m. Scale bars: 200 µm.
Figure 4
Figure 4
EGFR activation during active colonic injury reduces tumor size. (a) Animals were exposed to the AOM-DSS colitis-associated cancer model consisting of an intraperitoneal injection of 12.5 mg/kg azoxymethane (AOM) followed after 7 d by a single round of 3% DSS injury for 6 d. Treatments consisted of either 1 µg/d EGF or saline intraperitoneal injections, or oral gavage of either 200 mg/kg/d gefitinib or control diluent (vehicle), given during the DSS injury cycle. (b,c) Administration of EGF did not alter body weight loss (b), but treatment with gefitinib replicated the pattern of accelerated weight loss (c) shown in Fig. 1. Arrows indicate treatment days. (d) EGF treatment reduced tumor size, as shown by gross analysis of the distal colonic surface, with select polyps outlined in red. (e,f) Quantification of EGF’s effects showed no change in tumor number in the distal colon (e) but a significant reduction in tumor size (f). Each dot on the plot in (f) represents the mean tumor diameter observed from all tumors found in a single animal. (g,h) H&E-stained sections reveal the polypoid structures and size disparity of tumors obtained from saline- (g) and EGF-treated (h) mice. Images were acquired at 40× magnification. (ik) Oral gavage of gefitinib similarly did not affect tumor number, but increased tumor size in the distal colon, as shown in gross images of the colonic mucosal surface (i). Polyps were manually identified, counted (j), and their diameters measured (k) and compared between treatment groups. (l,m) Histological sections demonstrate the overall structure of tumors and their size difference between vehicle (l) and gefitinib-treated animals (m). Images were acquired at 40× magnification. *p < 0.05; **p < 0.01; ***p < 0.001. Summary statistics: mean ± s.e.m. Scale bars: (d,i) 5 mm, (g,h,l,m) 200 µm.
Figure 5
Figure 5
EGFR activation after mucosal healing and tumor initiation increases tumor size. (a) 1 µg EGF, saline, 200 mg/kg gefitinib, or vehicle were given to mice for 30 d, beginning 2 months after mutagenesis (AOM) and induction of colonic injury (DSS). (bd) Gross images (b) of the distal colonic surface demonstrated that EGF increased tumor size, which is quantified by tumor multiplicity and diameter shown in (c) and (d), respectively. The perimeters of select polyps are outlined in red (b). (e,f) H&E-stained sections of distal colonic polyps from saline- (e) or EGF-treated (f) samples show the microstructures of highly dysplastic colonic epithelium which is enlarged in EGF-treated animals. Images were acquired at 40× magnification. (gi) Photos (g) of anatomical grossing of gefitinib-treated colons in this experimental schedule showed unchanged tumor number (h) but decreased tumor size (i). (j,k) The larger size of vehicle-treated (j) versus gefitinib-treated (k) tumors is also apparent in H&E-stained sections of distal colonic mucosa. *p < 0.05; **p < 0.01; ***p < 0.001. Summary statistics: mean ± s.e.m. Scale bars: (b,g) 5 mm, (e,f,j,k) 200 µm.
Figure 6
Figure 6
EGFR activity regulates colonic cytokine expression in the absence of injury. (a,b) Daily intraperitoneal 1 µg EGF injections for 6 d did not change overall structure of colonic crypts, as shown in H&E-stained sections of saline-treated (a) or EGF-treated (b) mice. (ce) No changes due to EGF treatment were observed in average crypt depth (c), colon weight (d), or colon length (e). (f) EGF treatment resulted in decreased colonic expression of Cxcl2, but expression levels of Il6, Ifng, and Il17a were unchanged. (gi) Daily gavage administration of 200 mg/kg gefitinib (GEF) for 6 d reduced average colonic crypt height, as shown in comparative H&E-stained sections of vehicle-treated (g) and gefitinib-treated (h) samples, with associated quantification (i). (j,k) This schedule of gefitinib administration did not impact colon weight (j) or colon length (k). (l) Administration of gefitinib (GEF) led to increased expression of Cxcl2 and Il6, but decreased expression of Il17a. *p < 0.05; **p < 0.01; ***p < 0.001. Summary statistics: mean ± s.e.m. Scale bars: 200 µm.

Similar articles

Cited by

References

    1. Loftus EV. Clinical epidemiology of inflammatory bowel disease: incidence, prevalence, and environmental influences. Gastroenterology. 2004;126:1504–1517. doi: 10.1053/j.gastro.2004.01.063. - DOI - PubMed
    1. Molodecky NA, et al. Increasing incidence and prevalence of the inflammatory bowel diseases with time, based on systematic review. Gastroenterology. 2012;142:46–54.e42. doi: 10.1053/j.gastro.2011.10.001. - DOI - PubMed
    1. Cosnes J, Gower–Rousseau C, Seksik P, Cortot A. Epidemiology and natural history of inflammatory bowel diseases. Gastroenterology. 2011;140:1785–1794.e4. doi: 10.1053/j.gastro.2011.01.055. - DOI - PubMed
    1. Nielsen OH, Ainsworth MA. Tumor necrosis factor inhibitors for inflammatory bowel disease. N. Engl. J. Med. 2013;369:754–762. doi: 10.1056/NEJMct1209614. - DOI - PubMed
    1. Olivera P, Danese S, Peyrin-Biroulet L. JAK inhibition in inflammatory bowel disease. Expert Rev. Clin. Immunol. 2017;13:693–703. doi: 10.1080/1744666X.2017.1291342. - DOI - PubMed

Publication types

MeSH terms