. 2018 Jun 14;8(1):9108.
doi: 10.1038/s41598-018-27490-2.

Experimental 3-D Ultrasound Imaging with 2-D Sparse Arrays using Focused and Diverging Waves

Affiliations

Experimental 3-D Ultrasound Imaging with 2-D Sparse Arrays using Focused and Diverging Waves

Emmanuel Roux et al. Sci Rep. .

Abstract

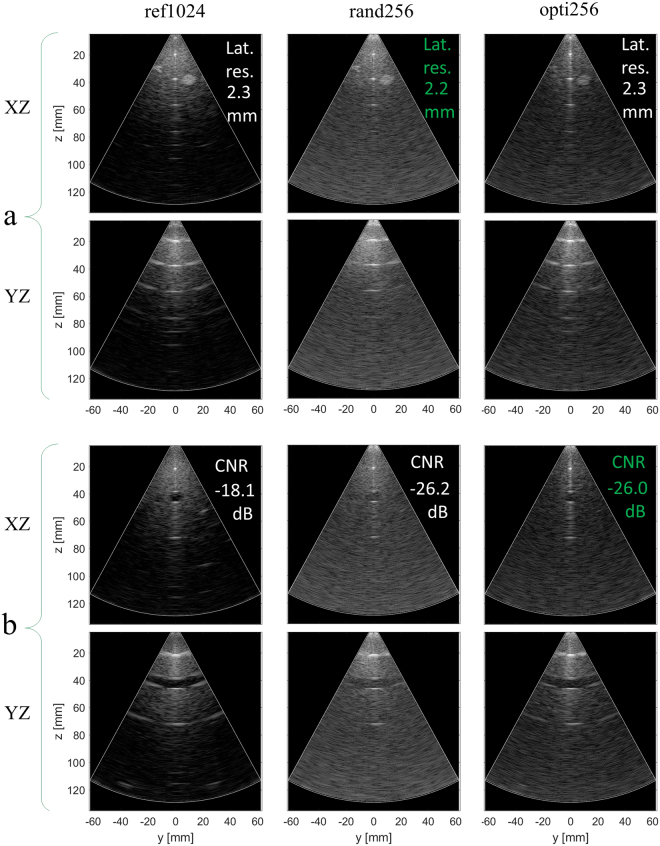
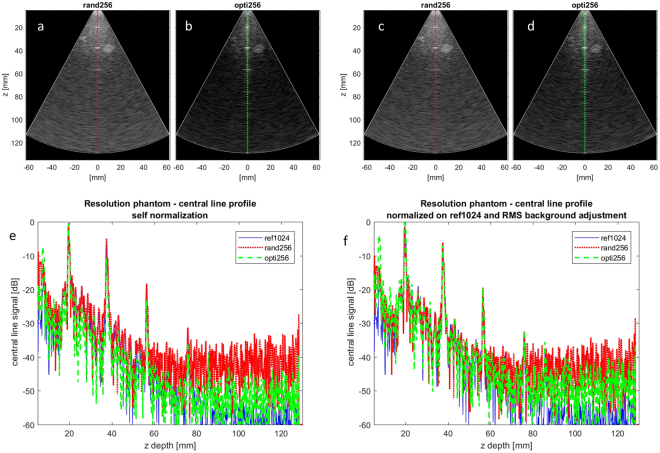
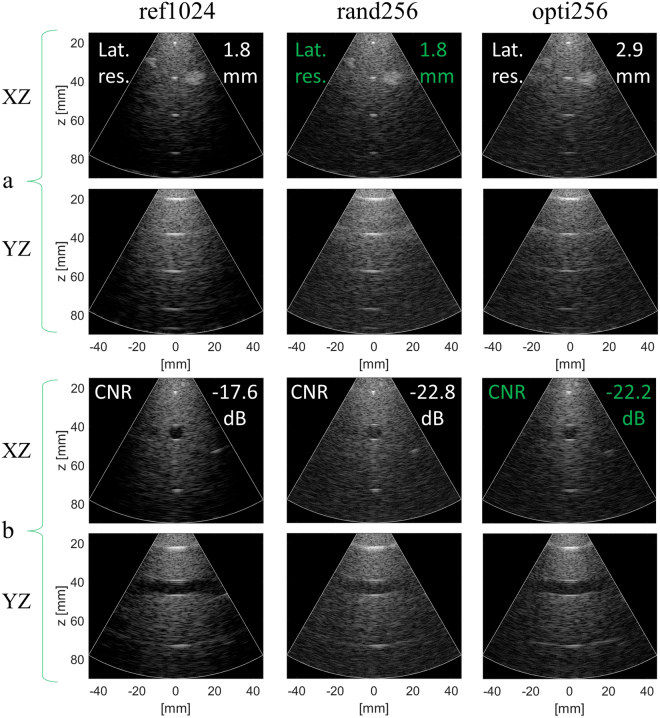
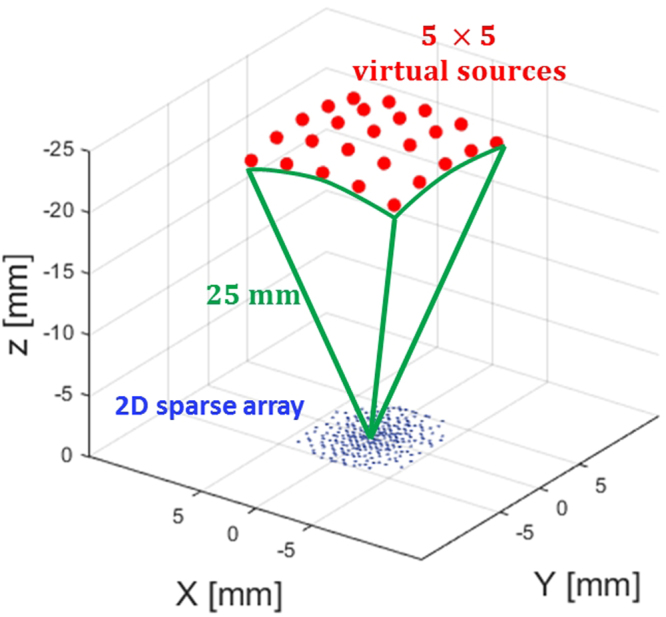
Three dimensional ultrasound (3-D US) imaging methods based on 2-D array probes are increasingly investigated. However, the experimental test of new 3-D US approaches is contrasted by the need of controlling very large numbers of probe elements. Although this problem may be overcome by the use of 2-D sparse arrays, just a few experimental results have so far corroborated the validity of this approach. In this paper, we experimentally compare the performance of a fully wired 1024-element (32 × 32) array, assumed as reference, to that of a 256-element random and of an "optimized" 2-D sparse array, in both focused and compounded diverging wave (DW) transmission modes. The experimental results in 3-D focused mode show that the resolution and contrast produced by the optimized sparse array are close to those of the full array while using 25% of elements. Furthermore, the experimental results in 3-D DW mode and 3-D focused mode are also compared for the first time and they show that both the contrast and the resolution performance are higher when using the 3-D DW at volume rates up to 90/second which represent a 36x speed up factor compared to the focused mode.


Conflict of interest statement

The authors declare no competing interests.

Figures

Figure 1
Figure 1
Phantom 3-D focused image slices for (a) resolution and (b) contrast evaluation comparison between the random array (rand256 on the right-hand column), the optimal sparse array opti256 central columns), and the reference array (ref1024 on the left-hand column). The best performance between the two sparse arrays is highlighted in green. The dynamic range is 60 dB. XZ and YZ refer to the central image planes in the azimuth and elevation direction, respectively.
Figure 2
Figure 2
(a,b) XZ slices (normalized on their own maximum) of the 3-D data backscattered by the CIRS (054GS) phantom when the rand256 and opti256 arrays were used in focused mode. (c,d) The background RMS adjustment of (a) and (b). (e) The central line profiles of the XZ slice resolution phantom images without the RMS background adjustment: the RMS background values are very different in particular for rand256. (f) The adjustment to make the RMS background value of rand256 and opti256 images match with the one obtained on the image of ref1024. The image dynamic range is 60 dB.
Figure 3
Figure 3
Phantom 3-D diverging wave image slices for (a) resolution and (b) contrast evaluation comparison between the reference array (ref1024 on the left-hand column), the random array (rand256 central column), and the optimal sparse array opti256 on the right-hand column). The best performance between the two sparse arrays is highlighted in green. The dynamic range is 60 dB. XZ and YZ refer to the central image planes in the azimuth and elevation direction respectively.
Figure 4
Figure 4
Illustration of the selected layouts: the reference array (ref1024), the random array (rand256), and the optimized array (opti256).
Figure 5
Figure 5
Illustration of the 25 virtual sources used to transmit diverging waves by means of 2-D sparse arrays. The virtual sources are located behind the array at a distance of 25 mm from the array centre.
Figure 6
Figure 6
Regions of interest used to estimate the lateral and axial resolutions (a,b) on the CIRS (054GS) phantom and (c,d) the CNR on the Gammex (Sono410 SCG) phantom (the two phantom structures are displayed on the right). The regions are shown for the focused (a,c) and the diverging wave (b,d) modes. For the CNR evaluation the region inside the cyst was delimited by the yellow square of diagonal 7.4 mm and the three different background regions are drawn as red squares (same size as the yellow one).

References

    1. Prager RW, Ijaz UZ, Gee AH, Treece GM. Three-dimensional ultrasound imaging. Proc. Inst. Mech. Eng. [H] 2010;224:193–223. doi: 10.1243/09544119JEIM586. - DOI - PubMed
    1. Fenster A, Downey DB, Cardinal HN. Three-dimensional ultrasound imaging. Phys. Med. Biol. 2001;46:R67. doi: 10.1088/0031-9155/46/5/201. - DOI - PubMed
    1. Nelson TR, Pretorius DH. Three-dimensional ultrasound imaging. Ultrasound Med. Biol. 1998;24:1243–1270. doi: 10.1016/S0301-5629(98)00043-X. - DOI - PubMed
    1. Provost J, et al. 3D ultrafast ultrasound imaging in vivo. Phys. Med. Biol. 2014;59:L1. doi: 10.1088/0031-9155/59/19/L1. - DOI - PMC - PubMed
    1. Sugeng L, et al. Quantitative Assessment of Left Ventricular Size and Function Side-by-Side Comparison of Real-Time Three-Dimensional Echocardiography and Computed Tomography With Magnetic Resonance Reference. Circulation. 2006;114:654–661. doi: 10.1161/CIRCULATIONAHA.106.626143. - DOI - PubMed

Publication types

LinkOut - more resources