. 2018 Apr 25;14(6):586-598.
doi: 10.7150/ijbs.23256. eCollection 2018.

FGF23 and Fetuin-A Interaction in the Liver and in the Circulation

Affiliations

FGF23 and Fetuin-A Interaction in the Liver and in the Circulation

Deborah Mattinzoli et al. Int J Biol Sci. .

Abstract

Recently it has been demonstrated that Fetuin-A, an anti-inflammatory protein synthesized by the liver, is produced also in bone by an FGF23-regulated pathway. FGF23 has been also demonstrated to induce inflammatory cytokine production in the liver. This study aimed to explore if FGF23 plays a role in the Fetuin-A production in the liver cells too and the possible relationships with FGF23 pro-inflammatory effects. FGF23 and Fetuin-A were studied in liver, kidney and in plasma with immunochemistry, immunoprecipitation, western blot, chromatin immunoprecipitation, duolink, ELISA, qrtPCR methodology. FGF23 is produced, but not secreted by the liver cells. In hepatocytes and circulation, FGF23 was present only strictly linked to Fetuin-A, while Fetuin-A was found also in unbounded form. No link was observed in the kidney. FGF23 up to 600 pg/ml stimulates, while, at higher concentrations, reduces Fetuin-A expression. Notably, overall the range of concentrations, FGF23 stimulates Fetuin-A promoter, TNFα and IL6 expression. In the nucleus, FGF23 seems to act as a direct transcription factor of Fetuin-A promoter. These results suggest that FGF23 played a direct regulatory role in Fetuin-A expression in liver cells with a biphasic effect: Fetuin-A progressively increases when FGF23 increases up to 400-600 pg/mL, and declines at higher FGF23 concentrations. These results lead us to hypothesize: a) a possible epigenetic post-transcriptional regulation; b) a possible counter-regulatory effect of FGF23 induced inflammatory cytokines (TNFα/ NF-κB mechanism). This study could add an additional key for the interpretation of the possible mechanisms linking FGF23, Fetuin-A and inflammation in CKD patients and suggests a role for FGF23 as transcription factor.

Keywords: Chronic kidney disease; Circulation; FGF23; Fetuin-A; Inflammation; Liver.


Conflict of interest statement

Competing Interests: The authors have declared that no competing interest exists.

Figures

Figure 1
Figure 1
IS (immunostaining) of Fetuin-A (A, D), FGF23 (B, E) and MERGE (C, F) visualized respectively by Fitc and rhodamine in mouse liver tissue; In panel I, a magnification of the part indicated by the rectangle in panel F is shown. The Neg Ctrl (G, H) exhibits only nuclear DAPI (4',6-diamidino-2-phenylindole) staining, attesting the cell presence. The arrow shows a faint parietal positivity for Fetuin-A, in a portal vein branch (H), but not in the bile duct and hepatic artery branch (G). Scale bars A, B, C: 100µm; D, E, F, G, H: 50µm.
Figure 2
Figure 2
Fetuin-A (A, D), FGF23 (B, E) and merge (C, F) expression visualized respectively by Fitc and rhodamine IS in primary hepatocytes and in HepG2. Arrows show Fetuin-A immunopositivity not co-localized. The negative Ctrl exhibits only nuclear DAPI staining (C, F in blue). Scale Bars: 50μm.
Figure 3
Figure 3
Fetuin-A (A), FGF23 (B), Clathrin (C) and MERGE expression (D) visualized respectively by Fitc, CY5 and rhodamine IS in HepG2. Scale Bars: 50μm.
Figure 4
Figure 4
mRNA expression of Fetuin-A and FGF23 in primary hepatocytes and HepG2 (A). qRT PCR of FGF23 in primary hepatocytes compared to podocytes (negative control) and OS (Positive Ctrl) (B). Asterisks indicate significant differences: ***=p<0.001 by Student's t-test. n=3/group.
Figure 5
Figure 5
WB of FGF23 on HepG2 FGF23/IP (AI) and on the portion non-FGF23/IP (negative Ctrl) with FGF23 (AII). WB of Fetuin-A on FGF23/IP (AIII) and on the aliquot non- FGF23/IP (AIV). Cofilin (bottom of the gel) acted as loading control (LC). Cell localization of Fetuin-A and FGF23 interactions detected by Duolink in situ experiment in HepG2 (B) and negative Ctrl (C) Scale bars: A, B: 50µm.
Figure 6
Figure 6
Cells Cultured medium harvested from primary hepatocytes, HepG2, and OS for measurement of intact FGF23 release, assessed by ELISA. (n=3/group; mean ±SD; data were normalized by Janus Green Nuclear marker; ***=p<0.001 OS vs all the other groups).
Figure 7
Figure 7
Changes in FGF23, Fetuin-A and TNFα mRNA expression after 24h from the addition of scalar FGF23 dose (A, B, C). qRT PCR of FGF23, Fetuin-A and TNFα in HepG2 after 24h from FGF23 overexpression (D, E, F). Asterisks indicate significant differences versus HepG2 (ctrl): *=p<0.01, **=p<0.01, ***=p<0.001 by Student's t-test. n=3/group.
Figure 8
Figure 8
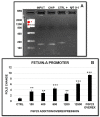
Semi-quantitative PCR of Fetuin-A promoter of HepG2 after FGF23/CHIP. Product size of human Fetuin-A promoter 146bp (A). Changes in Fetuin-A promoter expression after 24h from the addition of scalar FGF23 dose and after 24h from FGF23 overexpression (B). Asterisks indicate significant differences versus HepG2 (ctrl): **=p<0.01, ***=p<0.001 by Student's t-test. n=3/group.
Figure 9
Figure 9
Fetuin-A (A), FGF23 (B) and merge (C) IS in the periportal vein interstice (human liver). Cell co-localization of Fetuin-A and FGF23 detected by Duolink in situ experiment in the plasma of a CKD patient (D). Scale Bars: 50μm. FGF23 WB in the FGF23/IP plasma samples of 3 CKD patients with high FGF23 levels (E P1I, P2III, P3V) and 2 CKD patients with low FGF23 levels (E P4, P5) and in the non-FGF23/IP plasma samples of the first three high FGF23 patients (E P1II, P2IV, P3VI). Fetuin-A WB in the FGF23/IP plasma samples of 3 CKD patients with high FGF23 levels (E P1VII, P2IX, P3XI, P4, P5) and 2 CKD patients with low FGF23 levels (E P4, P5) and in the non-FGF23/IP plasma samples of the first three high FGF23 patients (E P1VIII, P2X, P3XII).
Figure 10
Figure 10
IS of Fetuin (A), FGF23 (B) and merge (C) after cytospin centrifugation, IS of Fetuin (D), FGF23 (E) and merge (F) after plasma smear in human plasma. Scale bars: 50μm.
Figure 11
Figure 11
IS of Fetuin (A), FGF23 (B) and merge (C) in human kidney tissue. Scale bars: 50μm.

References

    1. Kaneko I, Tatsumi S, Segawa H, Miyamoto KI. Control of phosphate balance by the kidney and intestine. Clin Exp Nephrol; 2016. Review. - PubMed
    1. Messa P. FGF23 and vascular calcifications: another piece of the puzzle? Nephrol Dial Transplant. 2014;29(8):1447–9. - PubMed
    1. Shimada T, Kakitani M, Yamazaki Y, Hasegawa H, Takeuchi Y, Fujita T. et al. Targeted ablation of Fgf23 demonstrates an essential physiological role of FGF23 in phosphate and vitamin D metabolism. J Clin Invest. 2004;113(4):561–8. - PMC - PubMed
    1. Kawakami K, Takeshita A, Furushima K, Miyajima M, Hatamura I, Kuro-O M. et al. Persistent fibroblast growth factor 23 signalling in the parathyroid glands for secondary hyperparathyroidism in mice with chronic kidney disease. Sci Rep. 2017;7:40534. - PMC - PubMed
    1. Hasegawa H, Nagano N, Urakawa I, Yamazaki Y, Iijima K, Fujita T. et al. Direct evidence for a causative role of FGF23 in the abnormal renal phosphate handling and vitamin D metabolism in rats with early-stage chronic kidney disease. Kidney Int. 2010;78(10):975–80. - PubMed

Publication types

MeSH terms