. 2018 May 31:9:1203.
doi: 10.3389/fimmu.2018.01203. eCollection 2018.

Dysregulation of B Cell Activity During Proliferative Kidney Disease in Rainbow Trout

Affiliations

Dysregulation of B Cell Activity During Proliferative Kidney Disease in Rainbow Trout

Beatriz Abos et al. Front Immunol. .

Abstract

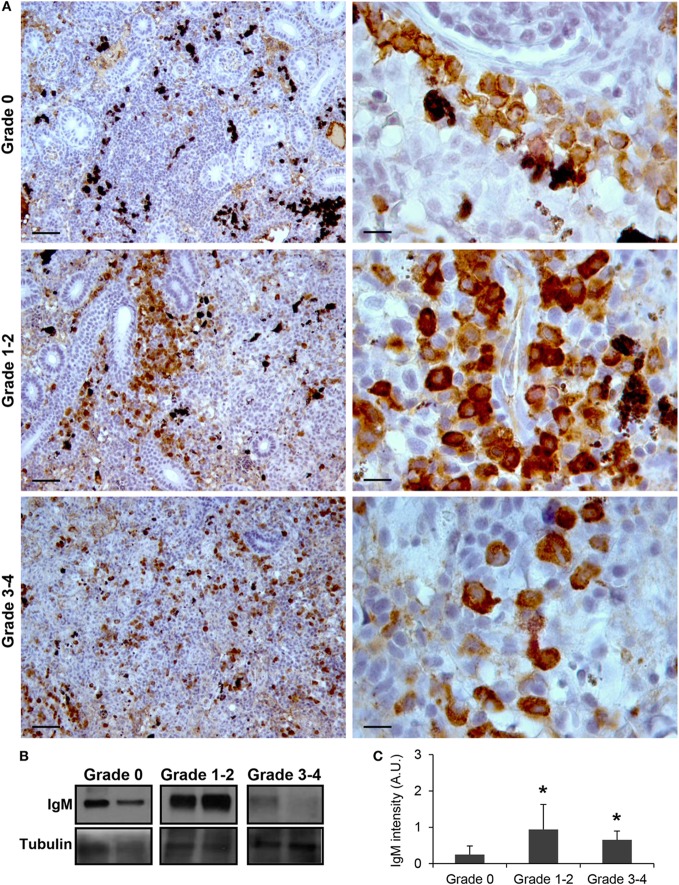
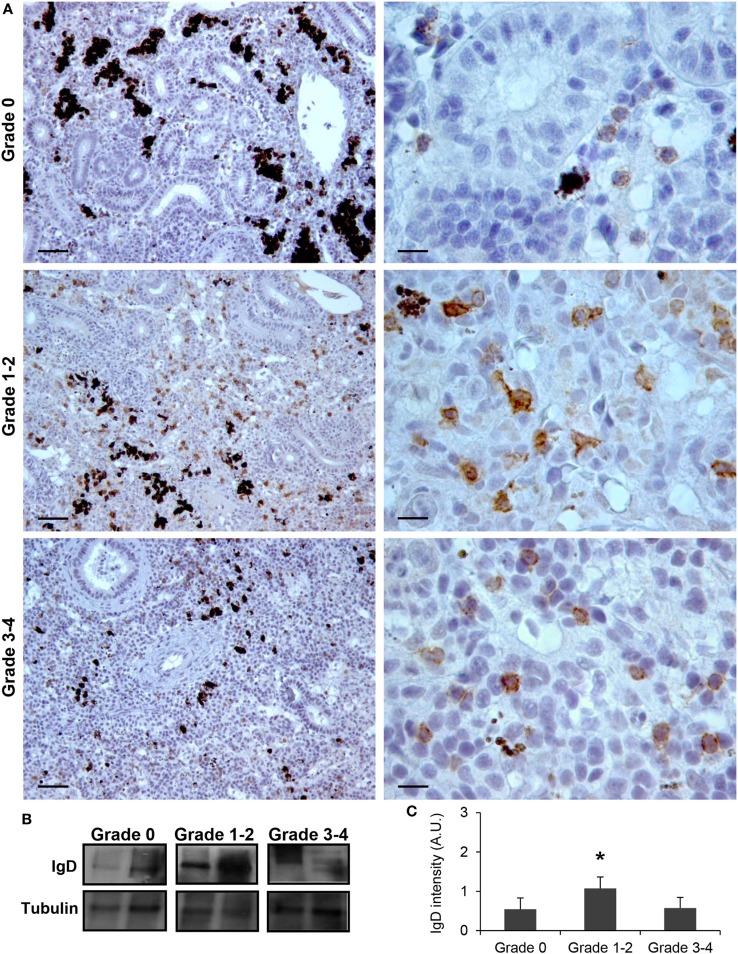
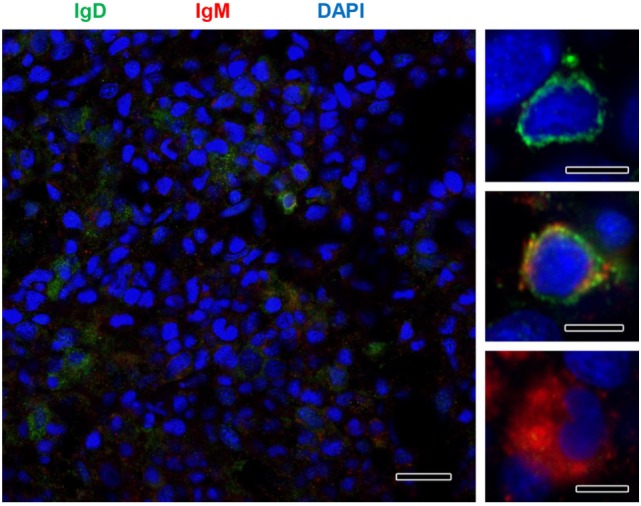
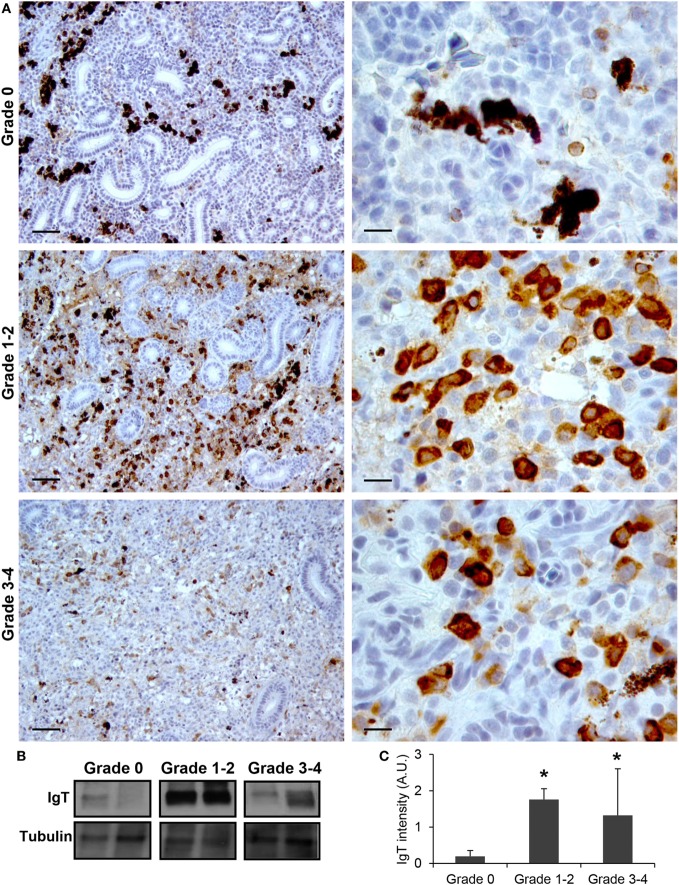
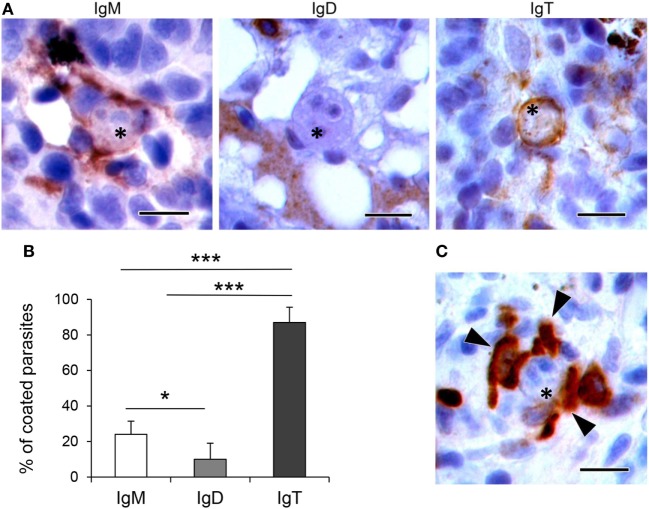
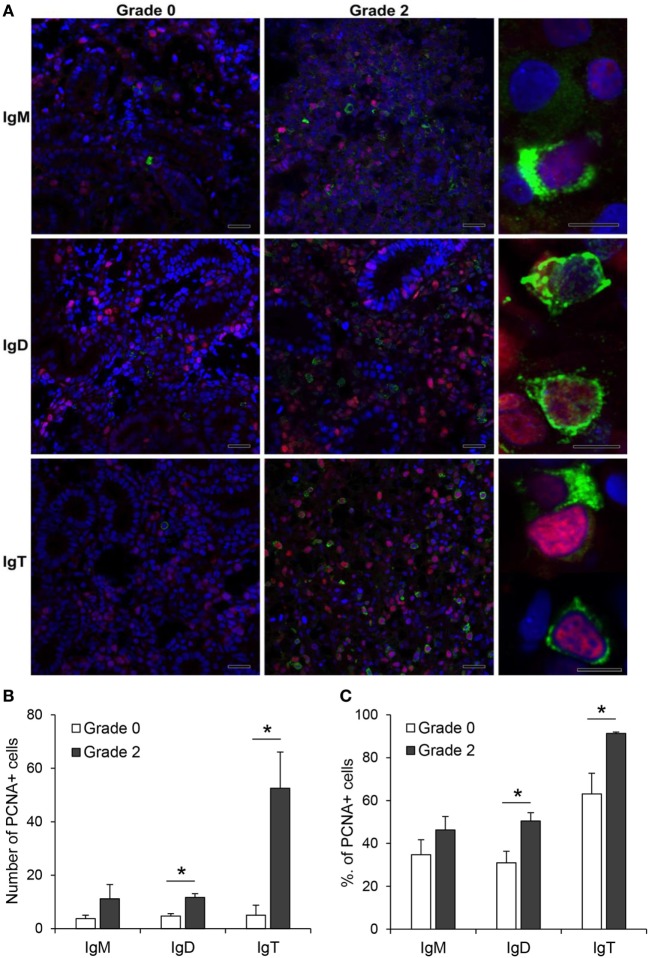
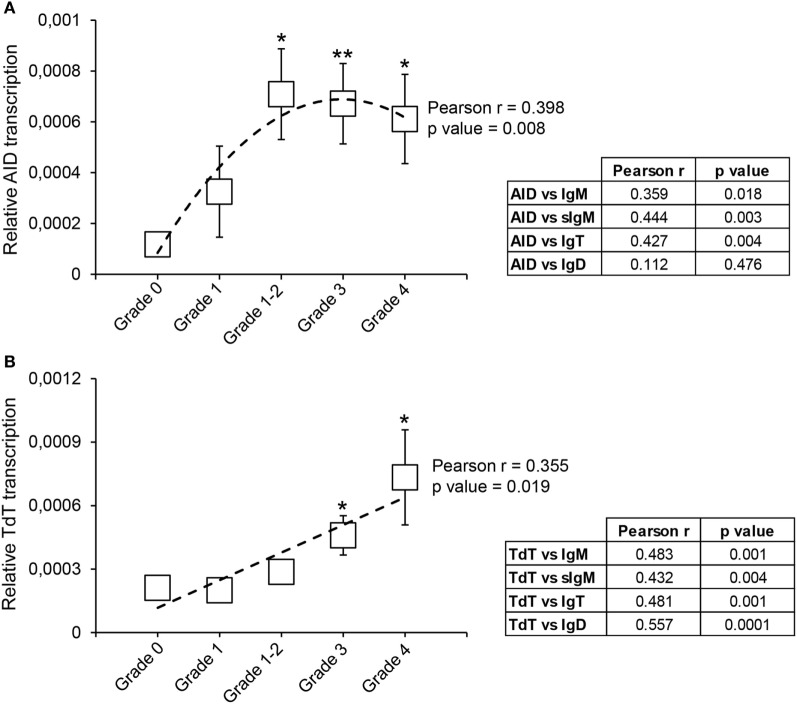
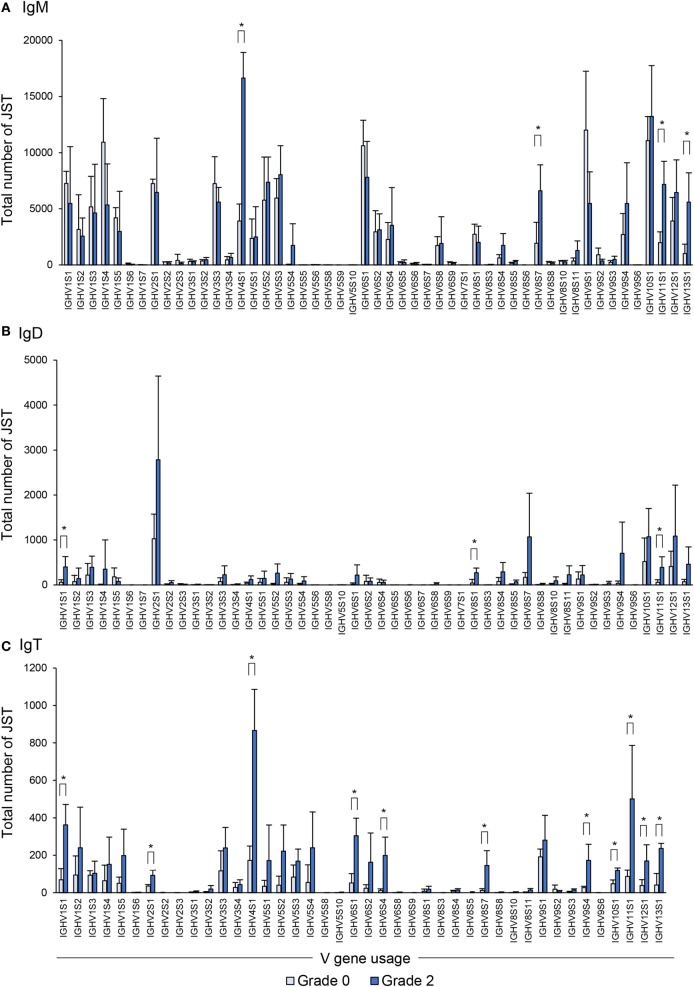
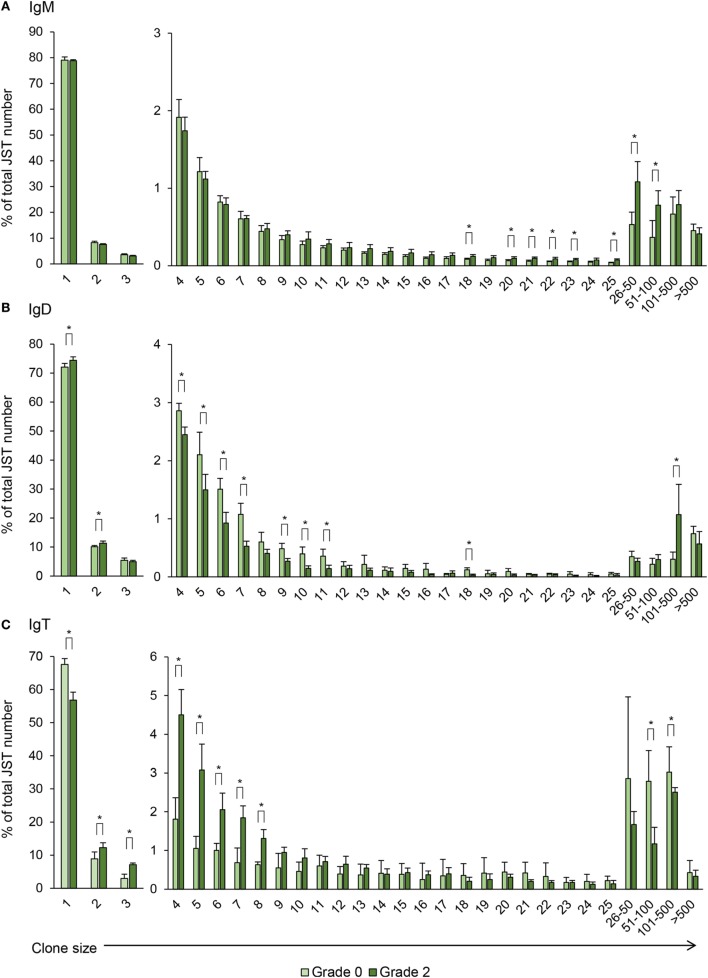
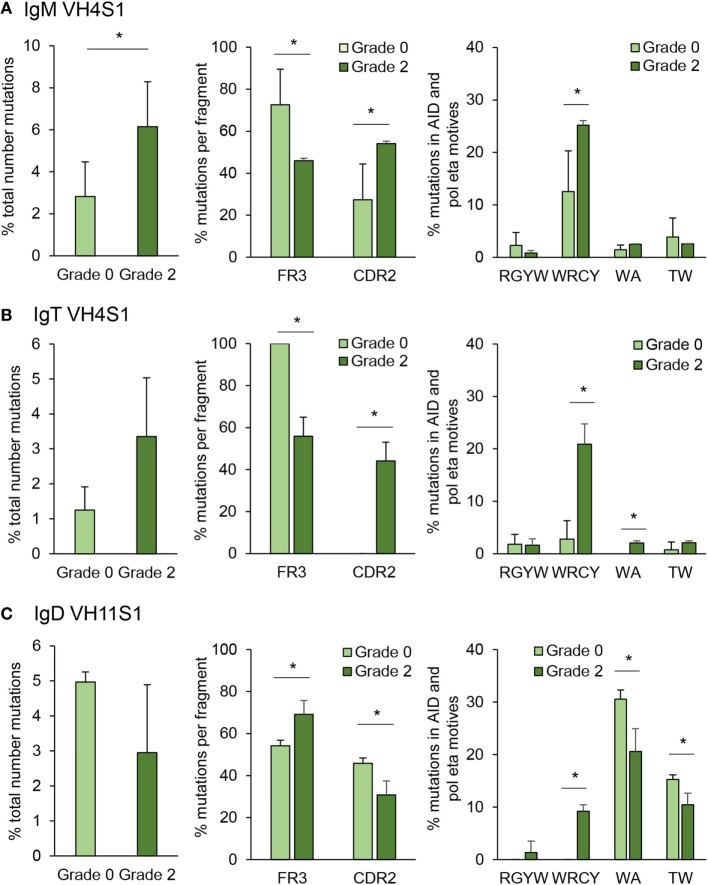
Proliferative kidney disease (PKD) is a widespread disease caused by the endoparasite Tetracapsuloides bryosalmonae (Myxozoa: Malacosporea). Clinical disease, provoked by the proliferation of extrasporogonic parasite stages, is characterized by a chronic kidney pathology with underlying transcriptional changes indicative of altered B cell responses and dysregulated T-helper cell-like activities. Despite the relevance of PKD to European and North American salmonid aquaculture, no studies, to date, have focused on further characterizing the B cell response during the course of this disease. Thus, in this work, we have studied the behavior of diverse B cell populations in rainbow trout (Oncorhynchus mykiss) naturally infected with T. bryosalmonae at different stages of preclinical and clinical disease. Our results show a clear upregulation of all trout immunoglobulins (Igs) (IgM, IgD, and IgT) demonstrated by immunohistochemistry and Western blot analysis, suggesting the alteration of diverse B cell populations that coexist in the infected kidney. Substantial changes in IgM, IgD, and IgT repertoires were also identified throughout the course of the disease further pointing to the involvement of the three Igs in PKD through what appear to be independently regulated mechanisms. Thus, our results provide strong evidence of the involvement of IgD in the humoral response to a specific pathogen for the first time in teleosts. Nevertheless, it was IgT, a fish-specific Ig isotype thought to be specialized in mucosal immunity, which seemed to play a prevailing role in the kidney response to T. bryosalmonae. We found that IgT was the main Ig coating extrasporogonic parasite stages, IgT+ B cells were the main B cell subset that proliferated in the kidney with increasing kidney pathology, and IgT was the Ig for which more significant changes in repertoire were detected. Hence, although our results demonstrate a profound dysregulation of different B cell subsets during PKD, they point to a major involvement of IgT in the immune response to the parasite. These results provide further insights into the pathology of PKD that may facilitate the future development of control strategies.

Keywords: B cells; Tetracapsuloides bryosalmonae; immunoglobulin D; immunoglobulin M; immunoglobulin T; proliferative kidney disease; rainbow trout.


Figures

Figure 1
Figure 1
IgM production increases during proliferative kidney disease infection. (A) Immunohistochemical detection of IgM+ cells in the kidney of parasite-infected (swelling grades 1–4) and parasite-naïve (swelling grade 0) fish. Representative images for fish with grade 0, grade 1–2, and grade 3–4 are shown at 20× magnification (left images, scale bars = 50 µm) and at 100× magnification (right images, scale bars = 10 µm). IgM production in kidney samples from each fish group was analyzed by Western blot. (B) Results from two representative individuals in each group are shown. (C) Abundance of IgM was quantified by optical densitometry and normalized against α-tubulin. Mean values in arbitrary units (A.U.) + SEM are shown (n = 4). Asterisks (*) denote significant differences (P < 0.05) between values obtained in grade 1–2 or grade 3–4 and grade 0 kidneys (analyzed by a two-tailed Student’s t-test).
Figure 2
Figure 2
IgD production increases during proliferative kidney disease infection. (A) Immunohistochemical detection of IgD+ cells in the kidney of parasite-infected (swelling grades 1–4) and parasite-naïve (swelling grade 0) fish. Representative images for fish with swelling grades 0, 1–2, and 3–4 are shown at 20× magnification (left images, scale bars = 40 µm) and at 100× magnification (right images, scale bars = 10 µm). IgD production in trunk kidney samples from each fish group was analyzed by Western blot. (B) Results from two representative individuals in each group are shown. (C) Abundance of IgD was quantified by optical densitometry and normalized against α-tubulin. Mean values in arbitrary units (A.U.) + SEM are shown (n = 4). Asterisks (*) denote significant differences (P < 0.05) between values obtained in grade 1–2 or grade 3–4 and grade 0 kidneys (analyzed by a two-tailed Student’s t-test).
Figure 3
Figure 3
IgM and IgD detection in rainbow trout kidney infected with Tetracapsuloides bryosalmonae. IgD (green) and IgM (red) were immunolabeled in grade 2 kidney sections and counterstained with DAPI (blue). Details show the presence of immunoreactive IgD+/IgM, IgD+/IgM+, and IgD/IgM+ B cells. Scale bar in left hand image = 20 µm; scale bars in right hand images = 5 µm.
Figure 4
Figure 4
IgT production increases during proliferative kidney disease infection. (A) Immunohistochemical detection of IgT+ cells in the kidney of parasite-infected (swelling grades 1–4) and parasite-naïve (swelling grade 0) fish. Representative images for fish with swelling grades 0, 1–2, and 3–4 are shown at 20× magnification (left images, scale bars = 40 µm) and at 100× magnification (right images, scale bars = 10 µm). IgT production in kidney samples from each fish group was analyzed by Western blot. (B) Results from two representative individuals in each group are shown. (C) Abundance of IgT was quantified by optical densitometry and normalized against α-tubulin. Mean values in arbitrary units (A.U.) + SEM are shown (n = 4). Asterisks (*) denote significant differences (P < 0.05) between values obtained in grade 1–2 or grade 3–4 and grade 0 kidneys (analyzed by a two-tailed Student’s t-test).
Figure 5
Figure 5
Coating of Tetracapsuloides bryosalmonae with host Igs. (A) Representative images showing parasites (indicated with asterisks) in the trunk kidney of rainbow trout coated with IgM, IgD, and IgT. Note the strong IgM and IgT immunoreactivity surrounding parasite stages, compared with low IgD immunoreactivity. Scale bars = 10 µm. (B) Mean percentage of parasites coated with each Ig. The presence and absence of IgM, IgD, and IgT immunoreactivity was recorded in 100 parasites from different individual fish with swelling grades from 1 to 4 (n = 6), and statistically significant differences between parasite coating with the different Ig calculated by a one-way ANOVA followed by two-tailed Student’s t-test (*P < 0.05 and ***P < 0.005). (C) Representative image showing several IgT+ cells (indicated with arrowheads) in close contact with a parasite (indicated with an asterisk). Scale bar = 10 µm.
Figure 6
Figure 6
Proliferation of IgM+, IgD+, and IgT+ cells in kidney. (A) Confocal microscopic images of rainbow trout kidney sections infected with Tetracapsuloides bryosalmonae exhibiting different swelling grades were labeled with anti-immunoglobulin (Ig) M, anti-IgD, or anti-IgT (green) in combination with anti-proliferating cell nuclear antigen (PCNA) (red). All sections were also counterstained with DAPI (blue). Representative images for grade 0 and grade 2 are shown (scale bars = 20 µm) along with representative images from grade 2 kidneys at higher magnification (right; scale bars = 5 µm). Note that in non-proliferating cells, nuclei appear blue whereas they appear violet in proliferating cells. Mean number (B) and mean percentage (C) of proliferating IgM+, IgD+, and IgT+ cells were calculated in 10 digital fields (400× magnification) from 6 different individuals. Statistically significant differences (P < 0.05) in proliferating IgM+, IgD+, and IgT+ cells between grade 0 and grade 2 fish (analyzed by one-way ANOVA followed by two-tailed Student’s t-test) are indicated with an asterisk.
Figure 7
Figure 7
Transcriptional regulation of activation-induced deaminase (AID) and terminal deoxynucleotidyl transferase (TdT) during proliferative kidney disease. Transcriptional levels of AID (A) and TdT (B) were evaluated by real-time PCR in kidney samples classified according to their swelling grade. Results are shown as the gene expression relative to the expression of an endogenous control (EF-1α) (mean ± SEM) (G0, n = 10; G1, n = 4; G1–2, n = 7; G2, n = 11; and G3, n = 9). Statistical differences between control and infected groups (analyzed with a two-tailed Student’s t-test) are shown as *P < 0.05 and **P < 0.01. A polynomic or linear regression is also shown (dotted line) to reveal the correlation between the expression of specific genes and the progression of the pathology, together with the Pearson product-moment correlation coefficient (r) and the statistical significance of the correlation (P value), which are indicated in the plots. Pearson product-moment correlation coefficient (r) and statistical significance of the correlation (P value) between AID (A) or TdT (B) transcription with the transcription of immunoglobulin (Ig) M, secreted IgM (sIgM), IgT, and IgD are included in the adjacent tables (right).
Figure 8
Figure 8
Differential usage of germline immunoglobulin (Ig) VH-gene segments during the B cell response to proliferative kidney disease. Bar charts show the average number (mean + SD) of unique sequences [V(D)J-CDR3(AA)] defined as junction sequence types (JST) identified for IgM (A), IgD (B), and IgT (C) for each VH family in grade 0 kidneys compared with grade 2 (n = 4). Statistical differences (P < 0.05) between the two groups (analyzed with a two-tailed Student’s t-test) are shown with an asterisk.
Figure 9
Figure 9
Clonal size distribution of junction sequence types (JST) during B cell response to proliferative kidney disease. Bar charts show the average percentage (mean + SD) of JST observed n times in the sequence datasets for IgM (A), IgD (B), and IgT (C) from grade 0 kidneys in comparison with grade 2 kidneys (n = 4). Statistical differences (P < 0.05) between the two groups (analyzed with a two-tailed Student’s t-test) are shown with an asterisk.
Figure 10
Figure 10
Targeting and patterns of somatic hypermutation identified for IgM (A), IgT (B), and IgD (C). Bar charts show the average percentages (mean + SD) of mutations in grade 0 or grade 2 kidneys (n = 4), assessed by analyzing CDR2-FR3 region transcripts encoding the VH4 family from IgM and IgT or VH11 for IgD. Statistical differences (P < 0.05) between the two groups (analyzed with a two-tailed Student’s t-test) are shown with an asterisk.

Similar articles

Cited by

References

    1. Hedrick RP, Macconnell E, De Kinkelin P. Proliferative kidney disease of salmonid fish. Annu Rev Fish Dis (1993) 3:277–90.10.1016/0959-8030(93)90039-E - DOI
    1. Grabner DS, El-Matbouli M. Tetracapsuloides bryosalmonae (Myxozoa: Malacosporea) portal of entry into the fish host. Dis Aquat Organ (2010) 90:197–206.10.3354/dao02236 - DOI - PubMed
    1. Zapata A, Diez B, Cejalvo T, Gutierrez-De Frias C, Cortes A. Ontogeny of the immune system of fish. Fish Shellfish Immunol (2006) 20:126–36.10.1016/j.fsi.2004.09.005 - DOI - PubMed
    1. Zwollo P, Cole S, Bromage E, Kaattari S. B cell heterogeneity in the teleost kidney: evidence for a maturation gradient from anterior to posterior kidney. J Immunol (2005) 174:6608–16.10.4049/jimmunol.174.11.6608 - DOI - PubMed
    1. Shiels A, Wickramasinghe SN. Expression of an erythropoietin-like gene in the trout. Br J Haematol (1995) 90:219–21.10.1111/j.1365-2141.1995.tb03406.x - DOI - PubMed

Publication types

LinkOut - more resources