. 2018 Aug;127(2):569-575.
doi: 10.1213/ANE.0000000000003511.

Repeated Measures Designs and Analysis of Longitudinal Data: If at First You Do Not Succeed-Try, Try Again

Affiliations

Repeated Measures Designs and Analysis of Longitudinal Data: If at First You Do Not Succeed-Try, Try Again

Patrick Schober et al. Anesth Analg. 2018 Aug.

Abstract

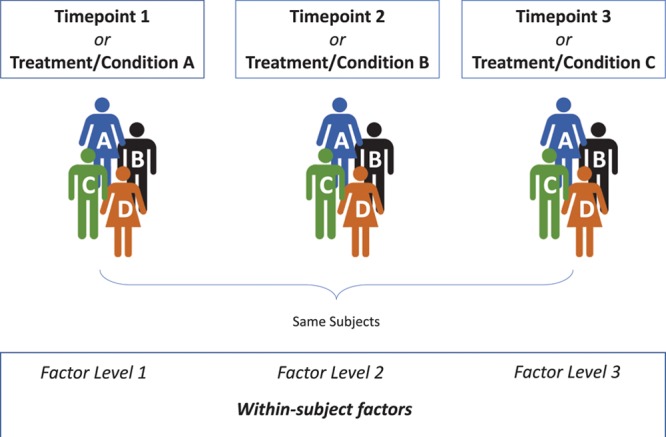
Anesthesia, critical care, perioperative, and pain research often involves study designs in which the same outcome variable is repeatedly measured or observed over time on the same patients. Such repeatedly measured data are referred to as longitudinal data, and longitudinal study designs are commonly used to investigate changes in an outcome over time and to compare these changes among treatment groups. From a statistical perspective, longitudinal studies usually increase the precision of estimated treatment effects, thus increasing the power to detect such effects. Commonly used statistical techniques mostly assume independence of the observations or measurements. However, values repeatedly measured in the same individual will usually be more similar to each other than values of different individuals and ignoring the correlation between repeated measurements may lead to biased estimates as well as invalid P values and confidence intervals. Therefore, appropriate analysis of repeated-measures data requires specific statistical techniques. This tutorial reviews 3 classes of commonly used approaches for the analysis of longitudinal data. The first class uses summary statistics to condense the repeatedly measured information to a single number per subject, thus basically eliminating within-subject repeated measurements and allowing for a straightforward comparison of groups using standard statistical hypothesis tests. The second class is historically popular and comprises the repeated-measures analysis of variance type of analyses. However, strong assumptions that are seldom met in practice and low flexibility limit the usefulness of this approach. The third class comprises modern and flexible regression-based techniques that can be generalized to accommodate a wide range of outcome data including continuous, categorical, and count data. Such methods can be further divided into so-called "population-average statistical models" that focus on the specification of the mean response of the outcome estimated by generalized estimating equations, and "subject-specific models" that allow a full specification of the distribution of the outcome by using random effects to capture within-subject correlations. The choice as to which approach to choose partly depends on the aim of the research and the desired interpretation of the estimated effects (population-average versus subject-specific interpretation). This tutorial discusses aspects of the theoretical background for each technique, and with specific examples of studies published in Anesthesia & Analgesia, demonstrates how these techniques are used in practice.


Conflict of interest statement

The authors declare no conflicts of interest.

Figures

Figure 1.
Figure 1.
Schematic representation of a one-way repeated-measures ANOVA. An outcome is repeatedly measured or observed for each subject (here: subjects A–D) at each time point or under each condition, allowing to assess how the outcome value changes within each subject. Therefore, a factor in which each subject’s outcome variable is repeatedly measured at each factor level (here: time point or condition), is referred to as a within-subject factor. One-way repeated-measures ANOVA compares the mean values of the outcome variable between the factor levels. ANOVA indicates analysis of variance.
Figure 2.
Figure 2.
Schematic representation of a two-way (two-factor) mixed ANOVA. The model includes a within-subject factor (Figure 1), but also a between-subject factor. Factors that vary between subjects are between-subject factors (here: a part of the subjects are assigned to treatment A, but other subjects are assigned to treatment B). A two-way mixed ANOVA tests for differences in the mean values of the outcome variable between the factor levels of the within-subject factor, between the factor levels of the between-subject factor, as well as the interaction of the 2. ANOVA indicates analysis of variance.
Figure 3.
Figure 3.
Schematic representation of 4 working correlation structures commonly used in GEE estimation (A–D). The numbers 1–5 represent repetitive measurements, and the shade of the box represents the correlation between the 2 measurements, with a darker shade representing a stronger correlation. For example, the box on the cut-point between first row and third column (or vice versa) represents the correlation between the first and third measurements. While the correlation of a value with itself is always 1 (represented by the black boxes on the diagonal line), the off-diagonal correlations differ between the correlation structures. A, The independent correlation structure assumes uncorrelated measurements. B, Compound symmetry assumes all off-diagonal correlations to be equal. C, The autoregressive structure assumes decreasing correlations as the time interval increases. D, Unstructured correlation makes no assumptions and allows all correlations to differ. GEE indicates generalized estimating equation.
Figure 4.
Figure 4.
Simple example with only 1 explanatory variable (time as continuous covariate) to illustrate how linear regression assuming independent measurements differs from a mixed linear model. A, All data points are assumed to be independent. The solid line represents the regression line of the relationship between time and a hypothetical outcome measure. The difference (vertical distance) between each point and the regression line is termed residual, and the assumption of independence that we have rather informally stated in the text actually refers to independence of the residuals. As can be seen, the line does not seem to fit the data points very well, and the variance of the residuals seems to increase over time, violating a key assumption of linear regression. B, It can be see that the different data points in (A) are not independent but actually come from 4 subjects (represented by 4 different symbols and colors), measured at hourly intervals. The black line still represents the mean change in the dataset. However, by allowing each subject to have its own intercept and slope, the between-subject variability is now accounted for. The residuals are now much smaller as they represent the within-subject variability, ie, the difference of each data point from the regression line of the same subject. This allows for a more precise estimate of the subject-specific effect of time.

Similar articles

Cited by

References

    1. Ma Y, Mazumdar M, Memtsoudis SG. Beyond repeated-measures analysis of variance: advanced statistical methods for the analysis of longitudinal data in anesthesia research. Reg Anesth Pain Med. 2012;37:99–105.. - PMC - PubMed
    1. Albert PS. Longitudinal data analysis (repeated measures) in clinical trials. Stat Med. 1999;18:1707–1732.. - PubMed
    1. Mascha EJ, Sessler DI. Equivalence and noninferiority testing in regression models and repeated-measures designs. Anesth Analg. 2011;112:678–687.. - PubMed
    1. Zeger SL, Liang KY. An overview of methods for the analysis of longitudinal data. Stat Med. 1992;11:1825–1839.. - PubMed
    1. Vetter TR, Schober P. Regression: the apple does not fall far from the tree. Anesth Analg. 2018;127:277–283.. - PubMed