

Patterns of recovery from pain after cesarean delivery
- PMID: 29905650
- PMCID: PMC6328056
- DOI: 10.1097/j.pain.0000000000001313
Patterns of recovery from pain after cesarean delivery
Abstract
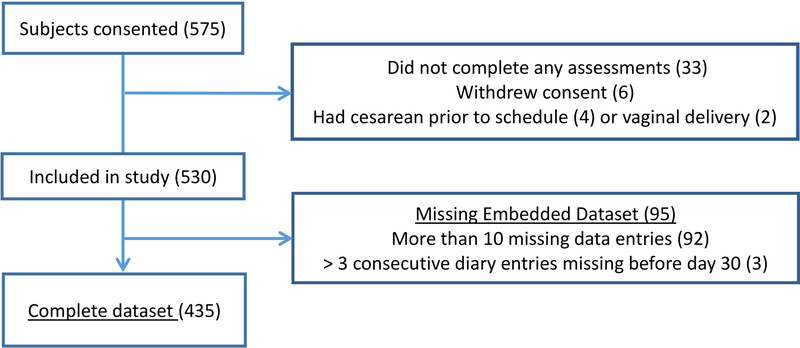
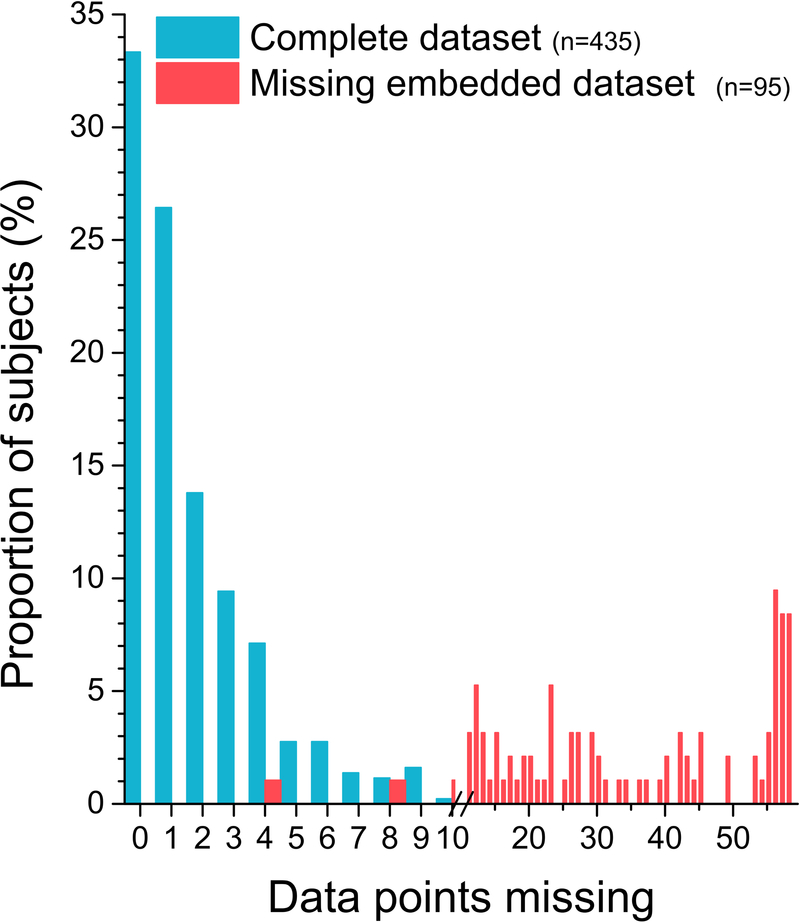
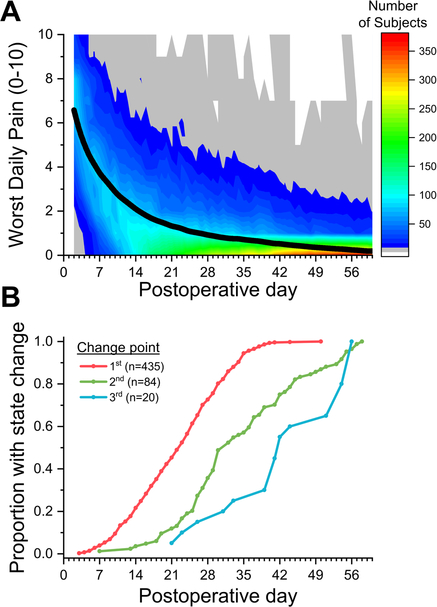
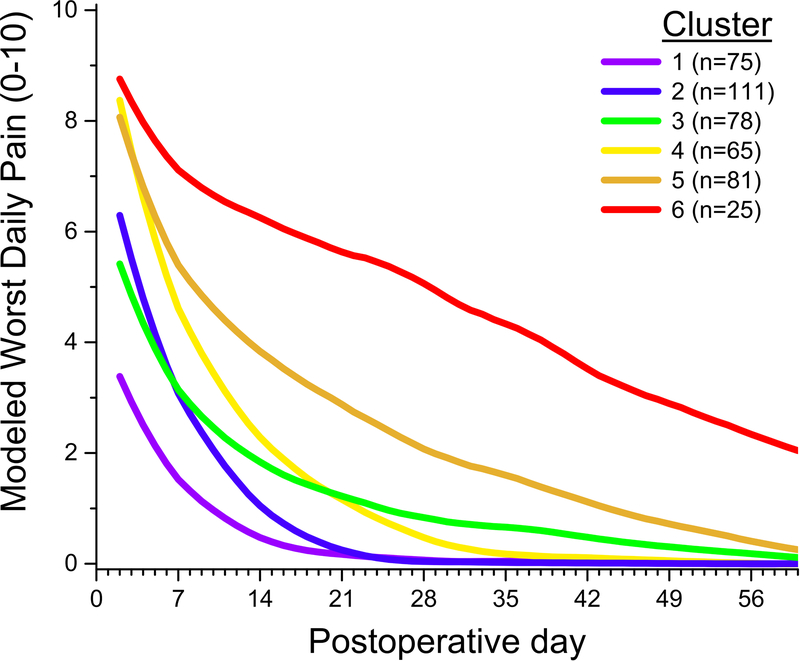
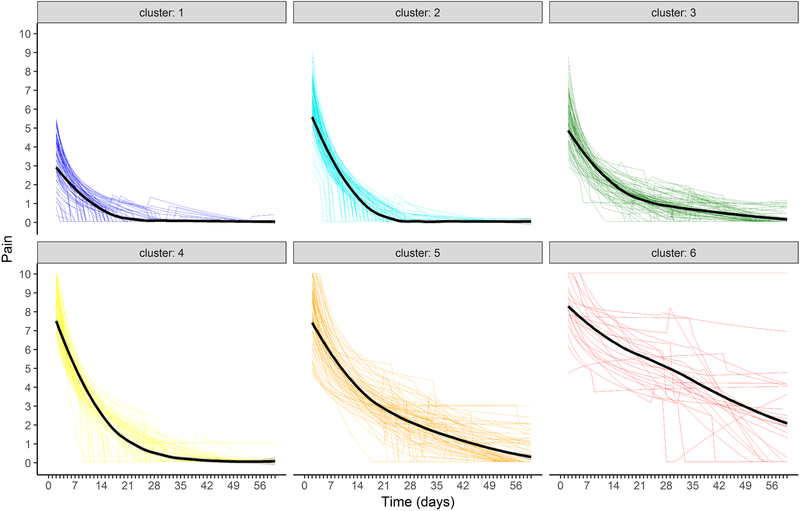
We know very little about the change in pain in the first 2 months after surgery. To address this gap, we studied 530 women scheduled for elective cesarean delivery who completed daily pain diaries for 2 months after surgery through text messaging. Over 82% of subjects missed fewer than 10 diary entries and were included in the analysis. Completers were more likely to be Caucasian, nonsmokers, and with fewer previous pregnancies than noncompleters. Daily worst pain intensity ratings for the previous 24 hours were fit to a log(time) function and allowed to change to a different function up to 3 times according to a Bayesian criterion. All women had at least one change point, occurring 22 ± 9 days postoperatively, and 81% of women had only one change, most commonly to a linear function at 0 pain. Approximately 9% of women were predicted to have pain 2 months after surgery, similar to previous observations. Cluster analysis revealed 6 trajectories of recovery from pain. Predictors of cluster membership included severity of acute pain, perceived stress, surgical factors, and smoking status. These data demonstrate feasibility but considerable challenges to this approach to data acquisition. The form of the initial process of recovery from pain is common to all women, with divergence of patterns at 2 to 4 weeks after cesarean delivery. The change-point model accurately predicts recovery from pain; its parameters can be used to assess predictors of speed of recovery; and it may be useful for future observational, forecasting, and interventional trials.
Conflict of interest statement
The remaining authors declare no conflicts of interest.
Figures
References
-
- Bruce J, Thornton AJ, Powell R, Johnston M, Wells M, Heys SD, Thompson AM, Cairns SW, Chambers WA, Scott NW. Psychological, surgical, and sociodemographic predictors of pain outcomes after breast cancer surgery: a population-based cohort study. Pain 2014;155(2):232–243. - PubMed
-
- Cohen S, Kamarck T, Mermelstein R. A global measure of perceived stress. J Health Soc Behav 1983;24(4):385–396. - PubMed
-
- Downie AS, Hancock MJ, Rzewuska M, Williams CM, Lin C-WC, Maher CG. Trajectories of acute low back pain: a latent class growth analysis. Pain 2016;157(1):225–234. - PubMed
MeSH terms
Grants and funding
LinkOut - more resources
Full Text Sources
Other Literature Sources
Medical
Miscellaneous
