. 2019 Mar;56(3):1558-1577.
doi: 10.1007/s12035-018-1174-x. Epub 2018 Jun 15.

Oxidation Resistance 1 Modulates Glycolytic Pathways in the Cerebellum via an Interaction with Glucose-6-Phosphate Isomerase

Affiliations

Oxidation Resistance 1 Modulates Glycolytic Pathways in the Cerebellum via an Interaction with Glucose-6-Phosphate Isomerase

Mattéa J Finelli et al. Mol Neurobiol. 2019 Mar.

Abstract

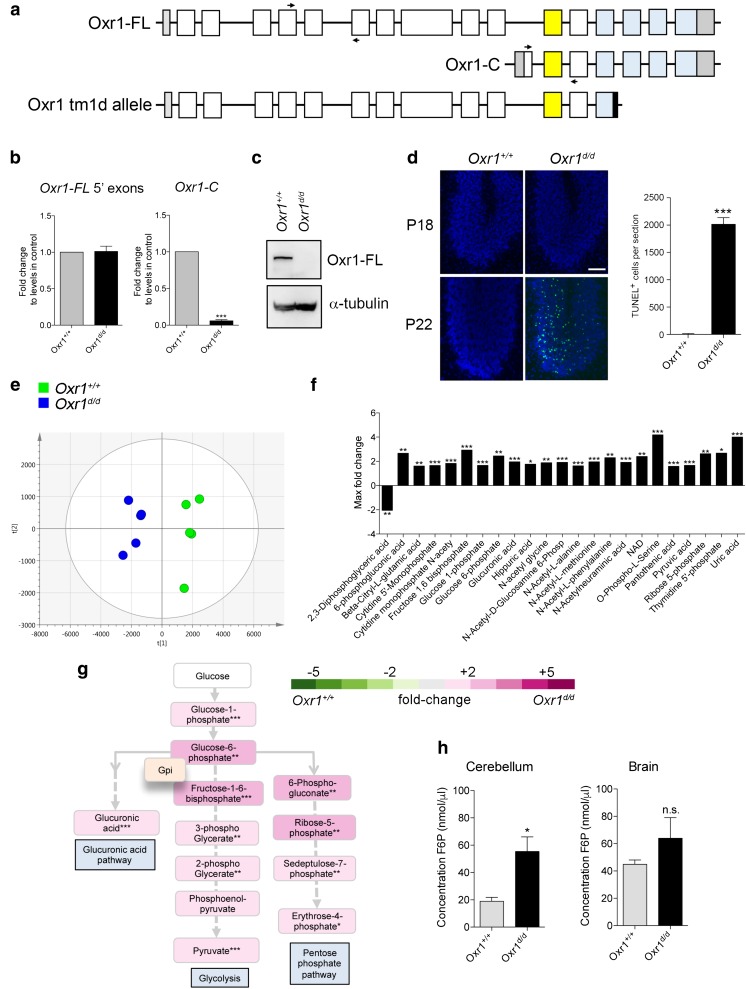
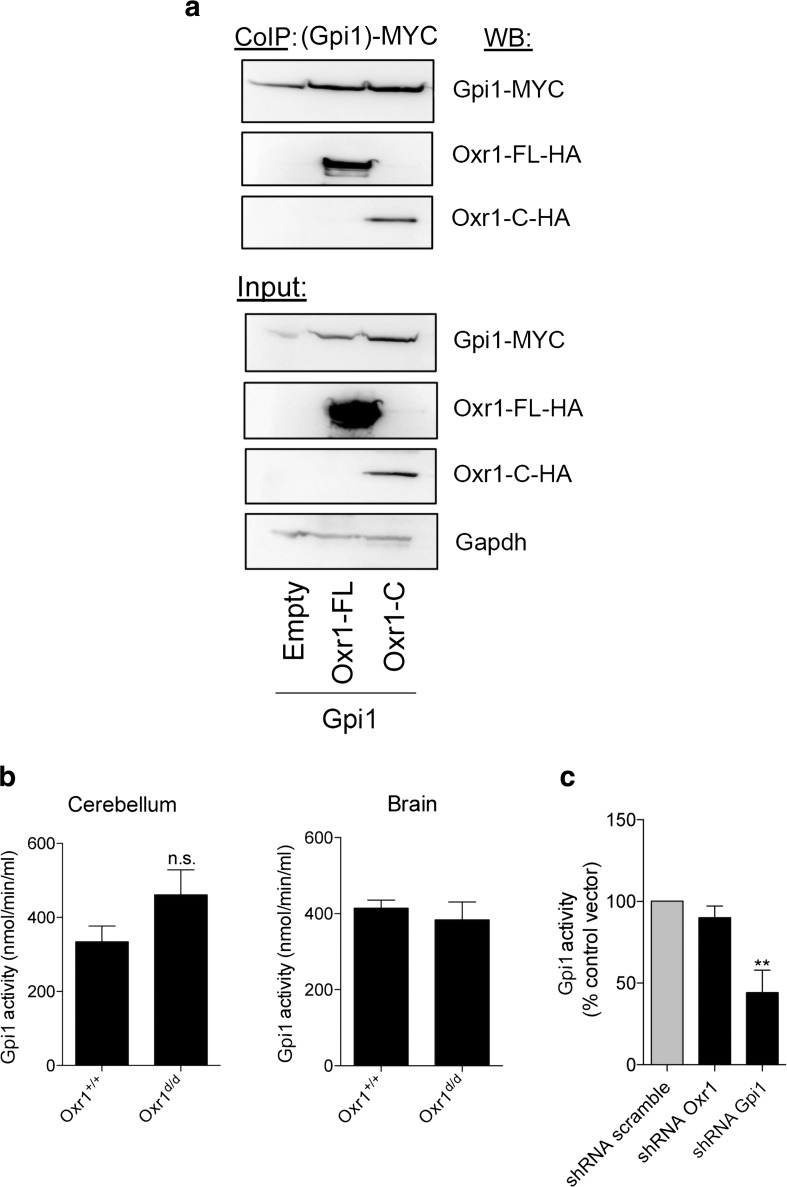
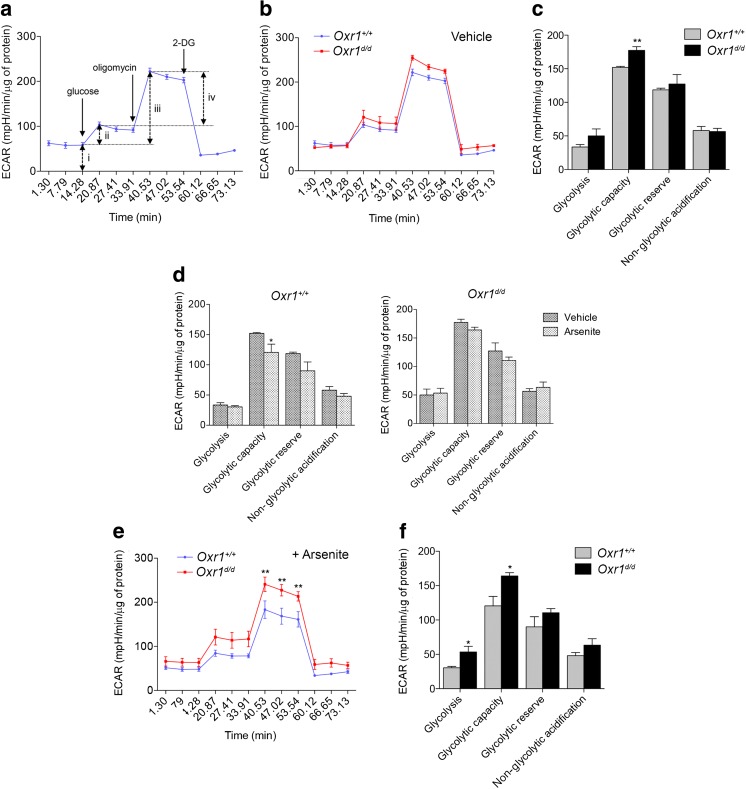
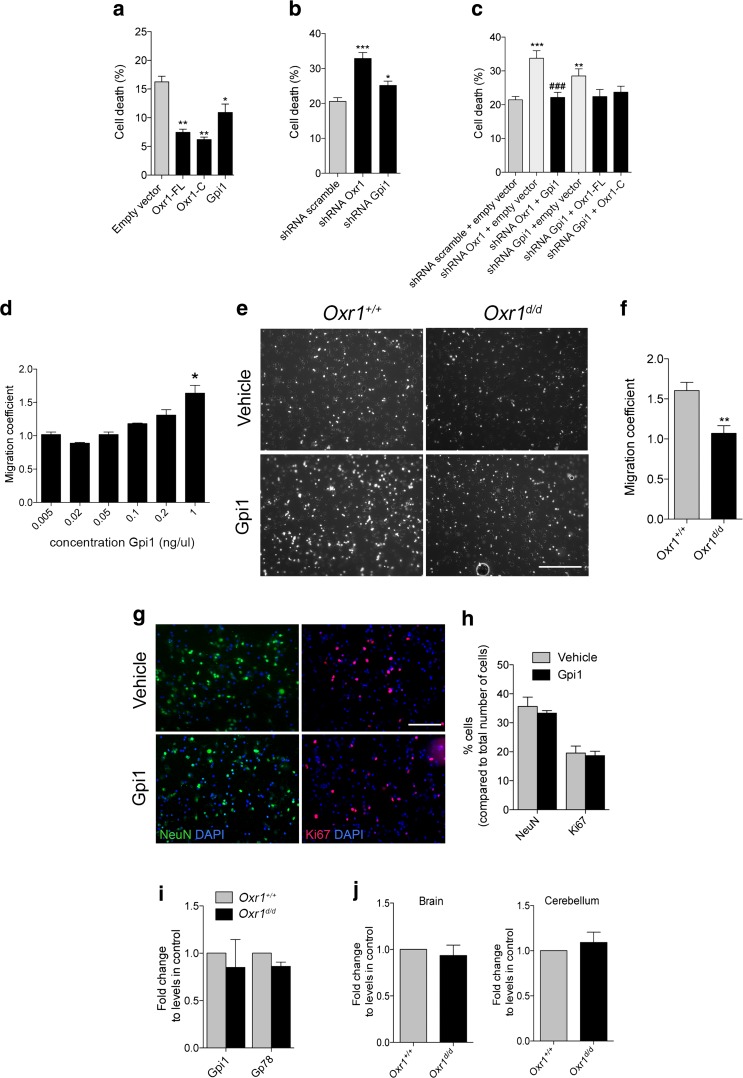
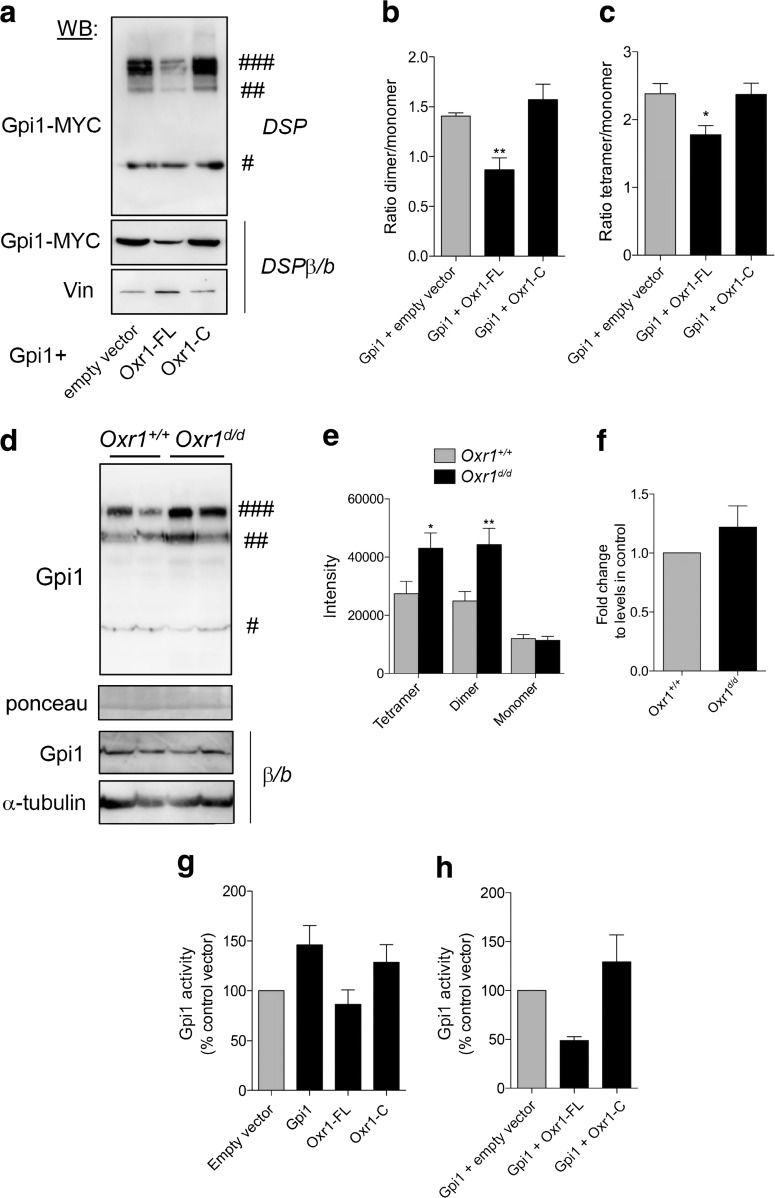
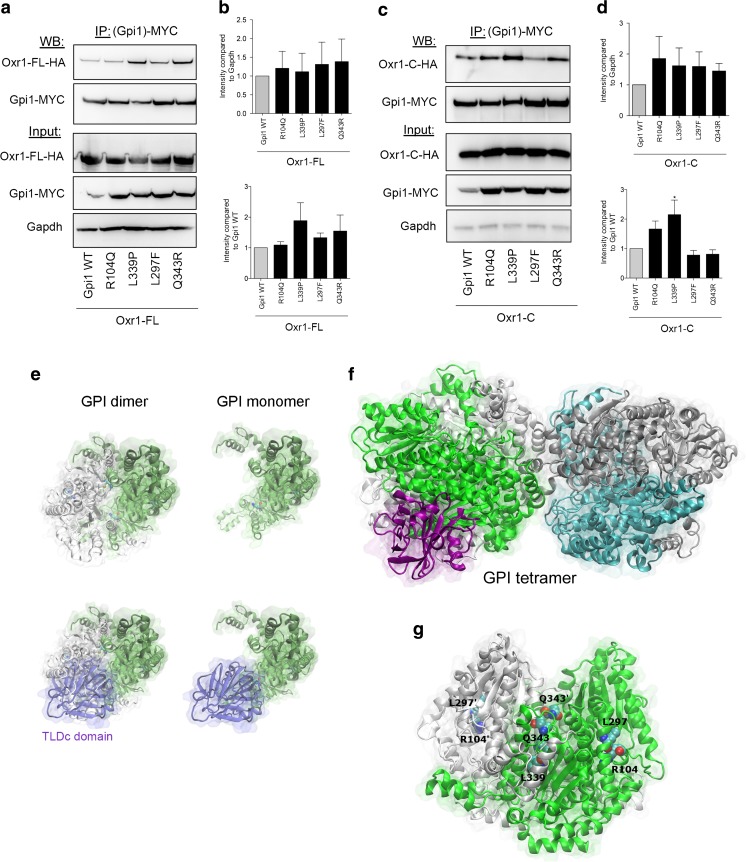
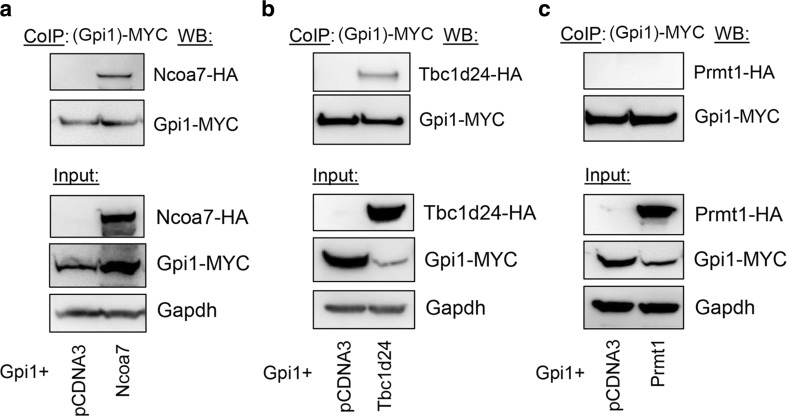
Glucose metabolism is essential for the brain: it not only provides the required energy for cellular function and communication but also participates in balancing the levels of oxidative stress in neurons. Defects in glucose metabolism have been described in neurodegenerative disease; however, it remains unclear how this fundamental process contributes to neuronal cell death in these disorders. Here, we investigated the molecular mechanisms driving the selective neurodegeneration in an ataxic mouse model lacking oxidation resistance 1 (Oxr1) and discovered an unexpected function for this protein as a regulator of the glycolytic enzyme, glucose-6-phosphate isomerase (GPI/Gpi1). Initially, we present a dysregulation of metabolites of glucose metabolism at the pre-symptomatic stage in the Oxr1 knockout cerebellum. We then demonstrate that Oxr1 and Gpi1 physically and functionally interact and that the level of Gpi1 oligomerisation is disrupted when Oxr1 is deleted in vivo. Furthermore, we show that Oxr1 modulates the additional and less well-understood roles of Gpi1 as a cytokine and neuroprotective factor. Overall, our data identify a new molecular function for Oxr1, establishing this protein as important player in neuronal survival, regulating both oxidative stress and glucose metabolism in the brain.

Keywords: Cerebellum; Glucose metabolism; Mouse; Neurodegeneration; Oxidative stress.


Figures

Fig. 1
Fig. 1
Glucose metabolism is deregulated in Oxr1 knockout mice. a Schematic indicating the exon structure of the longest full-length (FL) and shortest C-terminal (C) Oxr1 isoforms with the relative position of qRT-PCR primers indicated (arrows). The Oxr1 tm1d knockout allele is also shown that truncates all Oxr1 protein isoforms. Coding exons (white), UTRs (grey), an alternatively-spliced exon (yellow), and the TLDc domain (blue) are shown. Not to scale. b qRT-PCR of 5′ exons of Oxr1-FL and the Oxr1-C isoform in the cerebellum of Oxr1d/d mice (N = 4 animals per group). c Western blot of Oxr1-FL protein in cerebellum tissue of homozygous Oxr1d/d mice compared to a wild-type control (Oxr1+/+); alpha-tubulin was used as a loading control. d Representative TUNEL staining of cerebellum sections from Oxr1d/d and littermate control mice at P18 compared to disease end-stage at P24 with quantification of TUNEL-positive cells at P24 (N = 3 animals per group). Scale bar: 200 μm. e PCA analysis of metabolite profiling; each point on the PCA plot represents an individual sample. PCA analysis of metabolite profiles from cerebella of P18 Oxr1d/d (blue) compared to Oxr1+/+mice (green) (N = 5 animals per group). f Twenty-three metabolites significantly dysregulated by more than 1.6-fold in the cerebella of P18 Oxr1d/d compared to Oxr1+/+ mice. Fold-changes are based on per-run abundances for a specific metabolite which were then grouped by experimental condition (N = 4-5 animals per group). g Metabolites dysregulated in the Oxr1d/d cerebellum that are featured in pathways downstream of glucose-6-phosphate isomerase. The fold-changes between Oxr1+/+ and Oxr1d/d mice of the indicated metabolites are colour-coded. The position of the glycolytic enzyme glucose-6-phosphate isomerase (Gpi1) in the pathway is shown. A more detailed representation of the data is shown in Supplementary Fig. 2. h Fructose-6-phosphate levels are increased in the cerebellum but not the remaining brain tissue of Oxr1d/d mice compared to littermate Oxr1+/+ controls (N = 4 animals per group). Panels b, d, and h: t test, panel f, one-way ANOVA: *p < 0.05, **p < 0.01, ***p < 0.001
Fig. 2
Fig. 2
Oxr1 interacts with the glycolytic enzyme, glucose-6-phosphate isomerase. a Co-immunoprecipitation in HeLa cells over-expressing MYC-tagged Gpi1 with HA-tagged Oxr1-FL or Oxr1-C. b Gpi1 activity from whole cerebellum or remaining brain tissue of Oxr1d/d mice compared to Oxr1+/+ controls (N = 4–8 animals per group). c Gpi1 activity in N2a cells transfected with an shRNA against either Oxr1 or Gpi1 or corresponding control vector (shRNA scramble) (N = 4 independent repeats). Panel b: t test, panel c: one-way ANOVA; **p < 0.01
Fig. 3
Fig. 3
Glycolysis is altered in granule cells of Oxr1 knockout mice. a The extracellular acidification rate (ECAR) using the Seahorse glycolysis stress test assay; the timing of the compounds added to the assay medium are indicated (glucose to feed glycolysis, followed by oligomycin to inhibit mitochondrial ATP synthase and 2-deoxy-D-glucose (2-DG) to inhibit glycolysis) and the various parameters that can be calculated are represented by arrows (non-glycolytic acidification (i), glycolysis (ii), glycolytic capacity (iii), and glycolytic reserve (iv)). bf ECAR assay data from primary CGCs from Oxr1d/d and Oxr1+/+ mice in untreated (bd) or arsenite-treated (df) conditions (N = 4 animals per group for all panels). For comparative purposes, panel d represents the data from panels c and f. Panels b, e: two-way ANOVA, panels c, d, f: t test; *p < 0.05, **p < 0.01
Fig. 4
Fig. 4
Gpi1 functions are modulated by Oxr1. a Over-expression of Gpi1, Oxr1-FL, and Oxr1-C in N2a cells treated with arsenite and quantification of pyknotic nuclei as a measure of cell death (N = 3 independent repeats). b Knockdown of Oxr1 and Gpi1 by shRNA in arsenite-treated N2a cells with quantification of pyknotic nuclei (N = 5 independent repeats). c Knockdown of Oxr1 and Gpi1 by shRNA together with either Gpi1 or Oxr1 over-expression, respectively, with quantification of the number of pyknotic nuclei (N > 5 independent repeats). d Wild-type CGCs cultured on Transwell inserts were treated with increasing concentrations of recombinant of Gpi1 and the number of cells having migrated through the insert were quantified (N = 2 repeats). e Representative images of CGC migration after 24-h treatment with recombinant Gpi1. Scale bar: 200 μm. f Quantification of migration coefficient in Oxr1d/d and Oxr1+/+ cultures (N > 3 animals per group). gh Relative composition of primary cultures treated with either vehicle or recombinant Gpi1 and quantified by immunocytochemistry using a neuronal marker (NeuN) and a marker for proliferating cells (Ki67). Scale bar: 100 μm. i Expression of Gpi1 and its receptor, Gp78, in CGCs from Oxr1d/d mice compared to Oxr1+/+ by qRT-PCR (N = 4 animals per group). j Gp78 RNA expression levels in whole brain or cerebellum from P18 Oxr1d/d mice compared to control littermates by qRT-PCR (N = 4–5 animals per group). Panels ad: one-way ANOVA; f, hj: t test; *p < 0.05, **p < 0.01, ***p < 0.001 as compared to shRNA scramble plus empty vector, shRNA scramble, empty vector, Oxr1+/+ or vehicle; ###p < 0.001 as compared to shRNA Oxr1 plus empty vector
Fig. 5
Fig. 5
Oxr1 modulates Gpi1 oligomerisation. a Dimerisation of Gpi1 in cells co-transfected with Gpi1 and either an empty vector or full-length (Oxr1-FL) or short (Oxr1-C) Oxr1 isoforms. Cells were treated with a cross-linker (DSP) and proteins were extracted in PBS; the loading buffer did not contain any reducing β-mercaptoethanol and samples were not boiled (non-reducing conditions). As a control, protein extracts from cells treated with DSP were incubated with the reducing agent β-mercaptoethanol and boiled (DSPβ/b). Vinculin (Vin) levels were used to control for equivalent loading. bc Quantification of the dimeric (b) or tetrameric (c) versus monomeric forms of Gpi1 (N = 6 independent repeats). de Western blot and quantification showing Gpi1 oligomerization in cerebellum from Oxr1d/d and Oxr1+/+ mice from proteins extracted in PBS and non-reducing conditions. Ponceau staining was used to control for equal loading. As a control, protein extracts from the same preparations were incubated with the reducing agent β-mercaptoethanol and boiled (β/b). α-Tubulin levels were used to control for equivalent loading (N = 8 animals per group). f mRNA expression levels of Gpi1 in the cerebellum of Oxr1+/+ or Oxr1d/d mice by qRT-PCR (N = 4 animals per group). g Gpi1 activity in N2a cells transfected with the vectors indicated compared to an empty vector control (N = 3–5 independent repeats). h Gpi1 activity in N2a cells co-transfected with Gpi1 and either Oxr1-FL or Oxr1-C (N = 3 independent repeats). Panels b, c, g, h: one-way ANOVA; Panels e, f: t-test; *p < 0.05, **p < 0.01. Symbols #, ##, and ### represent Gpi1 monomer, dimer, and tetramer, respectively
Fig. 6
Fig. 6
Oxr1 binding affinity to Gpi1 is influenced by disease associated-mutations. ad Co-immunoprecipitations using an anti-MYC antibody and direct protein extracts in cells co-expressing MYC-tagged Gpi1 (wild-type (WT) or mutant constructs) with HA-tagged Oxr1-FL (panels ab N = 3 independent repeats) or Oxr1-C (panels cd N = 4 independent repeats). ef Predictions of the monomeric (e), dimeric (e), and tetrameric (f) forms of mouse Gpi1 interacting with the TLDc domain. g Representation of the Gpi1 dimer with the positions of the key residues mutated and investigated highlighted. Panels b, d: one-way ANOVA; *p < 0.05
Fig. 7
Fig. 7
Ncoa7 and Tbc1d24 are protein interactors of Gpi1. Co-immunoprecipitation in HeLa cells co-transfected with MYC-tagged Gpi1 and either a control vector or HA-tagged Ncoa7, Tbc1d24, or an unrelated protein Prmt1 as a negative control.

Similar articles

Cited by

References

    1. Clarke DD, Sokoloff L (1999) Chapter 31. Circulation and energy metabolism of the brain. In: Lippincott P (ed) Basic neurochemistry: molecular, cellular and medical aspects. pp 637–670
    1. Mergenthaler P, Lindauer U, Dienel GA, Meisel A. Sugar for the brain: the role of glucose in physiological and pathological brain function. Trends Neurosci. 2013;36(10):587–597. doi: 10.1016/j.tins.2013.07.001. - DOI - PMC - PubMed
    1. Cistaro A, Valentini MC, Chiò A, Nobili F, Calvo A, Moglia C, Montuschi A, Morbelli S, Salmaso D, Fania P, Carrara G, Pagani M. Brain hypermetabolism in amyotrophic lateral sclerosis: a FDG PET study in ALS of spinal and bulbar onset. Eur J Nucl Med Mol Imaging. 2012;39(2):251–259. doi: 10.1007/s00259-011-1979-6. - DOI - PubMed
    1. Yamashita T, Hatakeyama T, Sato K, Fukui Y, Hishikawa N, Ohta Y, Nishiyama Y, Kawai N, Tamiya T, Abe K. Flow-metabolism uncoupling in the cervical spinal cord of ALS patients. Neurol Sci. 2017;38(4):659–665. doi: 10.1007/s10072-017-2823-y. - DOI - PubMed
    1. López-Mora DA, Camacho V, Pérez-Pérez J, Martínez-Horta S, Fernández A, Sampedro F, Montes A, Lozano-Martínez GA, Gómez-Anson B, Kulisevsky J, Carrió I. Striatal hypometabolism in premanifest and manifest Huntington’s disease patients. Eur J Nucl Med Mol Imaging. 2016;43(12):2183–2189. doi: 10.1007/s00259-016-3445-y. - DOI - PubMed

LinkOut - more resources