. 2018 Jun 15;14(6):e1006278.
doi: 10.1371/journal.pcbi.1006278. eCollection 2018 Jun.

Classification of red blood cell shapes in flow using outlier tolerant machine learning

Affiliations

Classification of red blood cell shapes in flow using outlier tolerant machine learning

Alexander Kihm et al. PLoS Comput Biol. .

Abstract

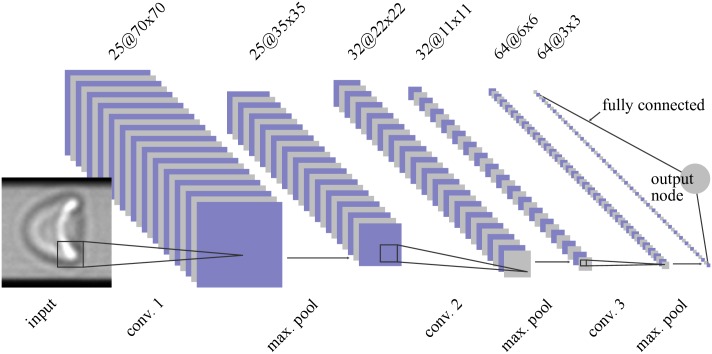
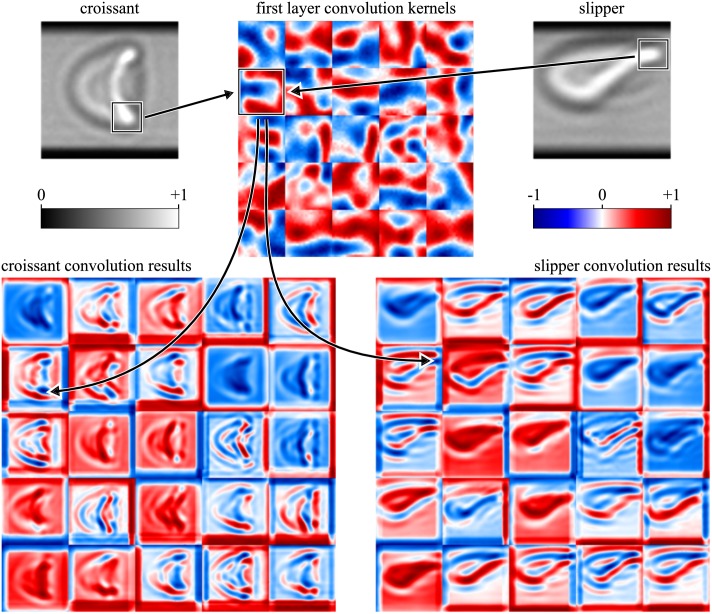
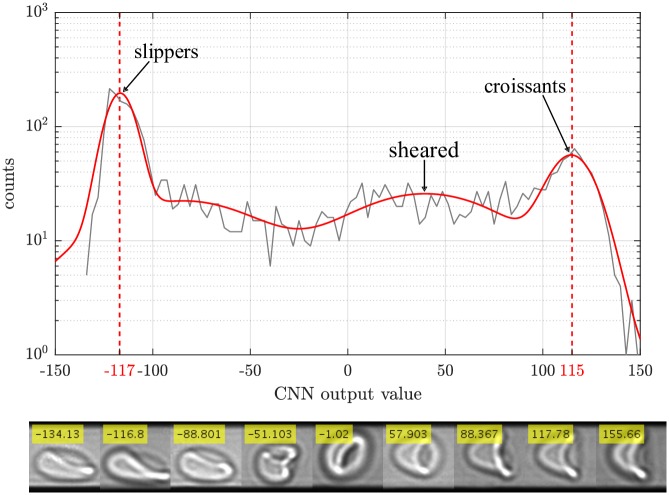
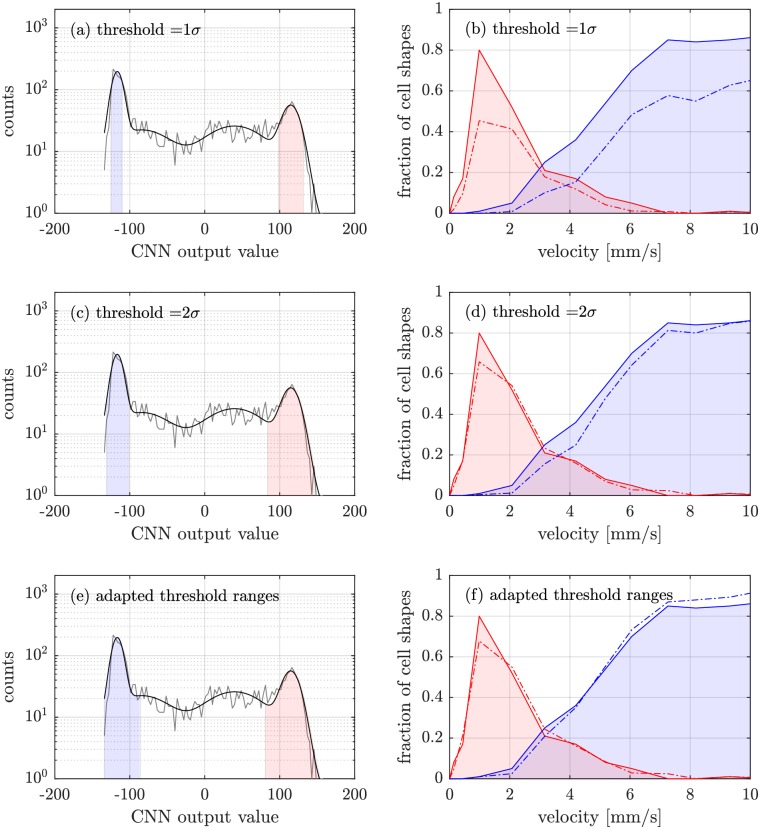
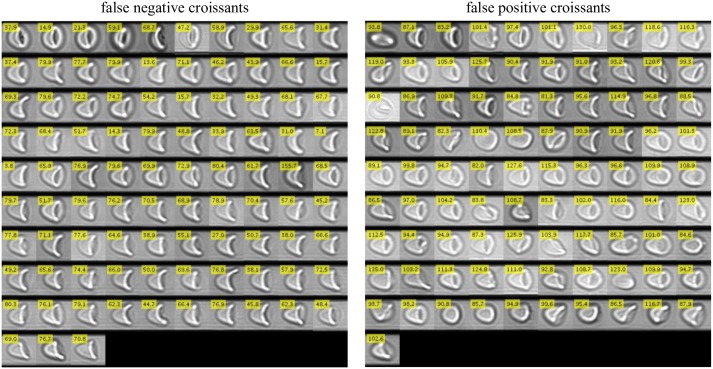
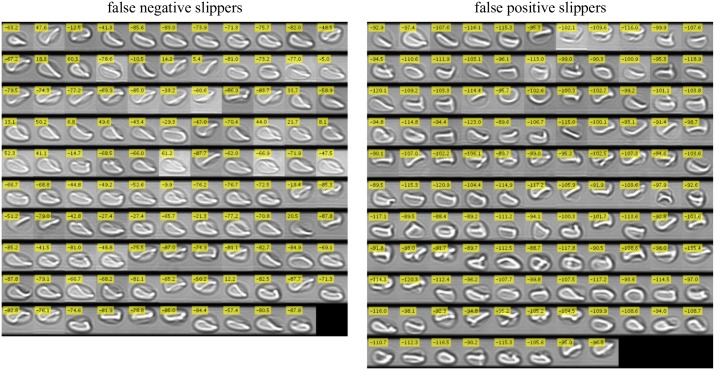
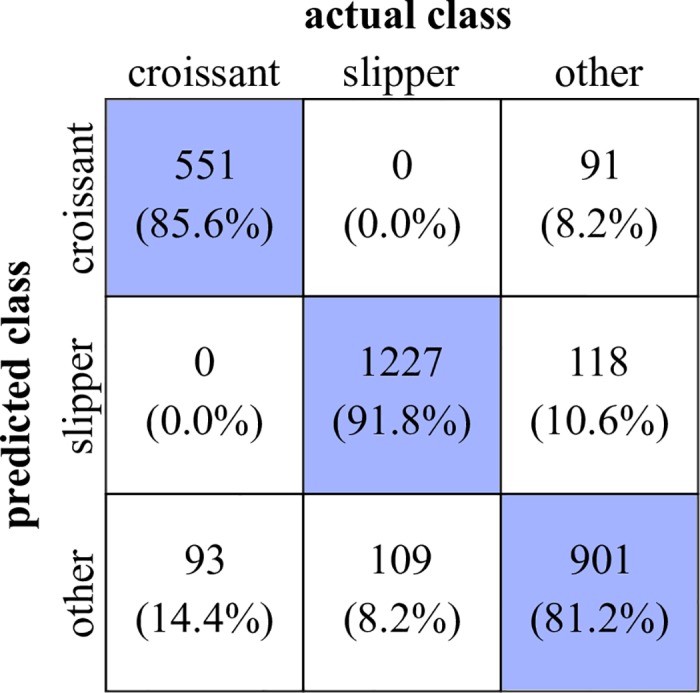
The manual evaluation, classification and counting of biological objects demands for an enormous expenditure of time and subjective human input may be a source of error. Investigating the shape of red blood cells (RBCs) in microcapillary Poiseuille flow, we overcome this drawback by introducing a convolutional neural regression network for an automatic, outlier tolerant shape classification. From our experiments we expect two stable geometries: the so-called 'slipper' and 'croissant' shapes depending on the prevailing flow conditions and the cell-intrinsic parameters. Whereas croissants mostly occur at low shear rates, slippers evolve at higher flow velocities. With our method, we are able to find the transition point between both 'phases' of stable shapes which is of high interest to ensuing theoretical studies and numerical simulations. Using statistically based thresholds, from our data, we obtain so-called phase diagrams which are compared to manual evaluations. Prospectively, our concept allows us to perform objective analyses of measurements for a variety of flow conditions and to receive comparable results. Moreover, the proposed procedure enables unbiased studies on the influence of drugs on flow properties of single RBCs and the resulting macroscopic change of the flow behavior of whole blood.


Conflict of interest statement

The authors have declared that no competing interests exist.

Figures

Fig 1
Fig 1. Layer structure of the used CNN.
The input layer accepts cell images of 90 × 90px2. Avoiding border effects (top and bottom) caused by irregular light refraction at the channel edges, input images are weighted by a Tukey window (α = 0.25) causing a fading effect towards the upper and lower edge (Eq 3). In a first processing stage, images are convoluted by 25 different convolution kernels of size 21 × 21. This results in 25 intermediate images of size 70 × 70px2, which undergo a non-linear rectification (reLU layer) before getting down-sampled by a max-pooling procedure (2 × 2, stride 2) to a size of 35 × 35px2. The combination of convolution, rectification, and max-pooling are repeated twice using different sets of convolution kernels (see Table 1). The output node then intertwines all resulting subimages by a full interconnection of all available pixel values and maps them to a linear output range. Sizes of subimages (blue/grey) as well as the indications of convolution kernels (black) are chosen to scale, illustrating that kernels obey the characteristic features of input and subimages.
Fig 2
Fig 2. Resulting subimages (bottom) of two contrary RBC shapes (croissant, upper left; slipper, upper right) passing the first convolutional layer of a CNN.
The convolution kernels as well as the subimages are represented by a false color mapping for the sake of better visibility. Boxes in the input images indicate typical features of both cell shape classes and the respective enhancement of these after convolution (indicated by arrows).
Fig 3
Fig 3. Diagram of training (red) and validation (black) status: Evolving convergence loss with growing number of training epochs.
We set a maximum of ten epochs since a prolongation to more training epochs yields no gain in performance but rather causes overtraining. As training method, a gradient descent solver with momentum (SGDM) is used. The red line indicates the training loss, whereas the black dots represent the loss of the validation data set (validation loss). The progression of the validation loss serves as an indicator whether the CNN is overtrained, since the training and validation losses would diverge. As loss function, a root-mean-square error is chosen, being a standard approach for regression problems.
Fig 4
Fig 4. We estimate perfect slippers to be around the peak of the distribution at ≈ −117, whereas croissants occur around ≈ 115.
By fitting the whole spectrum by four Gaussians, we are able to separate the respective contributions of each cell shape class and thus can determine a respective confidence interval. In the lower part, typical cell shapes are depicted for different output value ranges. Starting from the leftmost cell image, we undergo a shape change from slippers (image 1-3) to others (image 4-5) and finally to sheared (image 6-7) and pure croissants (image 8-9).
Fig 5
Fig 5. CNN output values for all cell images.
The gray solid line is the network’s output for the whole dataset, whereas the black solid line represents a fit with four Gaussians, one for each distinct class (croissants, slippers and sheared croissants, resp.) and one to account for indistinguishable cell shapes. The thresholds are shown in light blue and light red, respectively. In the right column, the obtained classification is compared with the manually ascertained phase diagram (solid lines). We stress the fact that the solid line is a guide to the eye, since we have a discrete number of flow veolcities due to the given number of applied pressure drops. In figure (b), a threshold of 1σ was used as a confidence interval to classify the cells into one of the two categories. Figures (d) and (f) show the resulting phase diagrams for a threshold of 2σ and an adapted σ, resp.
Fig 6
Fig 6. Image montage of all false negative (left) and false positive (right) classified croissants with respect to manual classification.
On the left, false negative croissants are shown, i.e. all cells being classified as croissant manually, but not by the neural network. In contrast, all cells classified as croissant shapes by automated analysis but not by hand are depicted in the right montage (false positive croissants). Numerical values given in the yellow box of each picture correspond to the respective output value of the CNN.
Fig 7
Fig 7. Image montage of all false negative (left) and false positive (right) classified slippers with respect to manually obtained classification.
All cells being classified as croissants manually but not by the CNN (false negative slippers) are depicted in the left image, whereas all false positive slippers are shown in the right montage (cells classified as slipper shapes by automated analysis but not by hand). Additionally, each cell image contains a yellow box with the according CNN output values.
Fig 8
Fig 8. Confusion matrix with absolute values and relative percentages to evaluate the performance of the CNN approach.
The rows hereby indicate the predicted, i.e. real class, whereas the columns indicate the actual class, corresponding to the CNN output. Thus, all values on the diagonal represent the correctly classified cells.

References

    1. Helfrich W. Elastic Properties of Lipid Bilayers: Theory and Possible Experiments. Z Naturforsch c. 1973;28:693–703. - PubMed
    1. Pries AR, Secomb TW. Blood flow in microvascular networks In: Microcirculation. Elsevier; 2008. p. 3–36.
    1. Skalak R, Branemark PI. Deformation of Red Blood Cells in Capillaries. Science. 1969;164(3880):717–719. doi: 10.1126/science.164.3880.717 - DOI - PubMed
    1. Freund JB, Orescanin MM. Cellular Flow in a Small Blood Vessel. J Fluid Mech. 2011;671:466–490. doi: 10.1017/S0022112010005835 - DOI
    1. Freund JB. The Flow of Red Blood Cells through a Narrow Spleen-like Slit. Phys Fluids. 2013;25(11):110807 doi: 10.1063/1.4819341 - DOI

Publication types