. 2018 Jun 15;14(6):e1006134.
doi: 10.1371/journal.pcbi.1006134. eCollection 2018 Jun.

Nonmechanistic forecasts of seasonal influenza with iterative one-week-ahead distributions

Affiliations

Nonmechanistic forecasts of seasonal influenza with iterative one-week-ahead distributions

Logan C Brooks et al. PLoS Comput Biol. .

Abstract

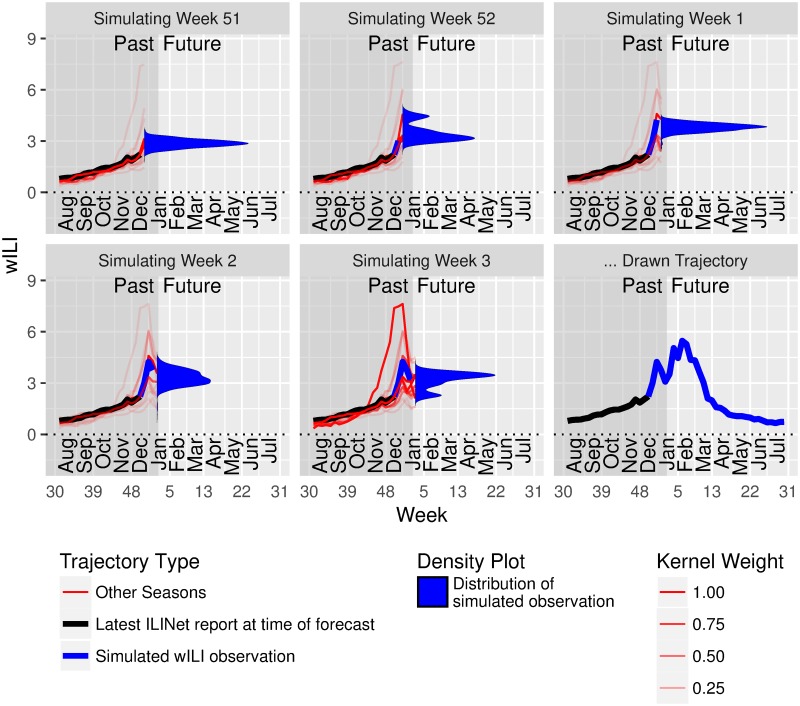
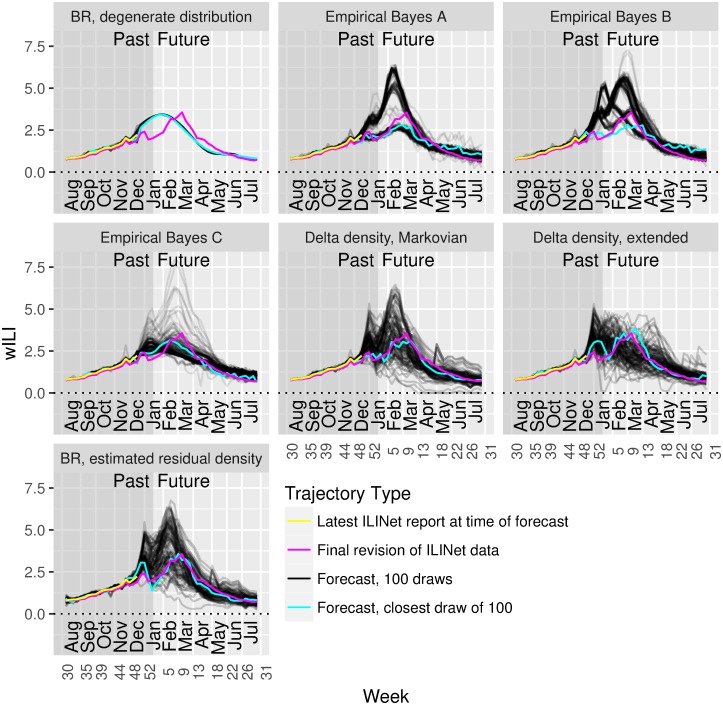
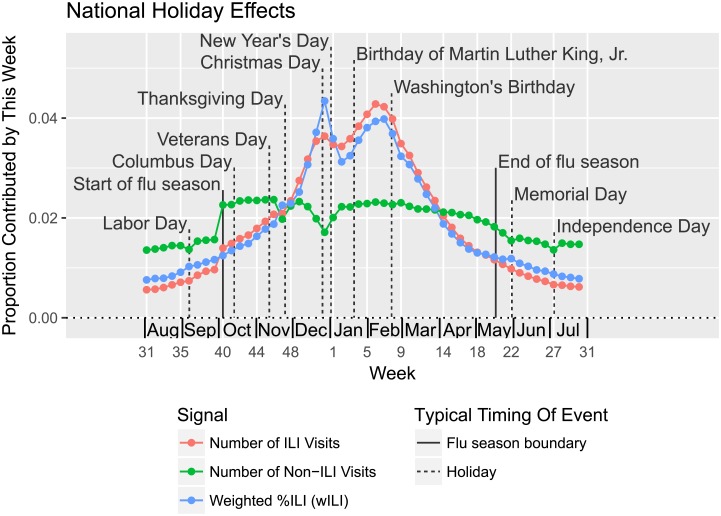
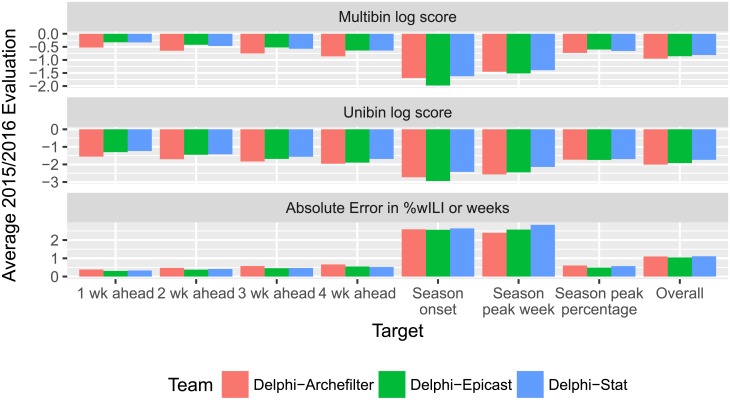
Accurate and reliable forecasts of seasonal epidemics of infectious disease can assist in the design of countermeasures and increase public awareness and preparedness. This article describes two main contributions we made recently toward this goal: a novel approach to probabilistic modeling of surveillance time series based on "delta densities", and an optimization scheme for combining output from multiple forecasting methods into an adaptively weighted ensemble. Delta densities describe the probability distribution of the change between one observation and the next, conditioned on available data; chaining together nonparametric estimates of these distributions yields a model for an entire trajectory. Corresponding distributional forecasts cover more observed events than alternatives that treat the whole season as a unit, and improve upon multiple evaluation metrics when extracting key targets of interest to public health officials. Adaptively weighted ensembles integrate the results of multiple forecasting methods, such as delta density, using weights that can change from situation to situation. We treat selection of optimal weightings across forecasting methods as a separate estimation task, and describe an estimation procedure based on optimizing cross-validation performance. We consider some details of the data generation process, including data revisions and holiday effects, both in the construction of these forecasting methods and when performing retrospective evaluation. The delta density method and an adaptively weighted ensemble of other forecasting methods each improve significantly on the next best ensemble component when applied separately, and achieve even better cross-validated performance when used in conjunction. We submitted real-time forecasts based on these contributions as part of CDC's 2015/2016 FluSight Collaborative Comparison. Among the fourteen submissions that season, this system was ranked by CDC as the most accurate.


Conflict of interest statement

The authors have declared that no competing interests exist.

Figures

Fig 1
Fig 1. The delta density method conditions on real and simulated observations up to week u − 1 when building a probability distribution over the observation at week u.
This figure demonstrates the process for drawing a single trajectory from the Markovian delta density estimate, ignoring the data revision process. The latest ILINet report, W1..tt, which incorporates observations through week 48, is shown in black. Kernel smoothing estimates for future values at times u from t + 1 to T are shown in blue, as are simulated observations drawn from these estimates. Past seasons’ trajectories are shown in red, with alpha values proportional to the weight they are assigned by the kernel Iu.
Fig 2
Fig 2. Delta and residual density methods generate wider distributions over trajectories than methods that treat entire seasons as units.
These plots show sample forecasts of wILI trajectories generated from models that treat seasons as units (BR, Empirical Bayes) and from models incorporating delta and residual density methods. Yellow, the latest wILI report available for these forecasts; magenta, the ground truth wILI available at the beginning of the following season; black, a sample of 100 trajectories drawn from each model; cyan, the closest trajectory to the ground truth wILI from each sample of 100.
Fig 3
Fig 3. On average, wILI is higher on holidays than expected based on neighboring weeks.
Weekly trends in wILI values, as expressed by the contribution of a each week to a sum of wILI values from seasons 2003/2004 to 2015/2016, excluding 2008/2009 and 2009/2010 (which include portions of the 2009 influenza pandemic), show spikes and bumps upward on and around major holidays. (U.S. federal holidays are indicated with event lines.) The number of non-ILI visits to ILINet health care providers spikes downwards on holidays (disproportionately with any drops in the number of ILI visits), contributing to higher wILI. The number of ILI visits generally declines in the second half of the winter holiday season, causing winter holiday peaks to appear even higher relative to nearby weeks. In addition to holiday effects, we see that average ILINet participation jumps upward on epi week 40, and gradually tapers off later in the season and in the off-season.
Fig 4
Fig 4. The three Delphi systems had similar overall scores; Delphi-Stat gave the best distributional forecasts overall, while Delphi-Epicast gave the best point predictions overall.
These bar plots contain evaluations for the 2015/2016 season, averaged across 11 locations and 29 forecast weeks, for each target and evaluation metrics. Shorter bars indicate better performance. Each entry for a specific target is an average of 319 evaluations, giving a total of 2233 evaluations overall for each system. This figure’s data is shown in tabular form in S2 Appendix.
Fig 5
Fig 5. Delta and residual density methods cover more observed events and attain higher average log scores than alternatives operating on seasons as a unit; ensemble approaches can eliminate missed possibilities while retaining high confidence when justified.
This figure contains histograms of cross-validation log scores for a variety of forecasting methods, averaged across seasons 2010/2011 to 2015/2016, all locations, forecast weeks 40 to 20, and all forecasting targets. A solid black vertical line indicates the mean of the scores in each histogram, which we use as the primary figure of merit when comparing forecasting methods; a rough error bar for each of these mean scores is shown as a colored horizontal bar in the last panel, and as a black horizontal line at the bottom of the corresponding histogram if the error bar is wider than the thickness of the black vertical line.
Fig 6
Fig 6. The ensemble method matches or beats the best component overall, consistently improves log score across all times, and, for some sets of components, can provide significant improvements in both log score and mean absolute error.
These plots display cross-validation performance for two ensembles and some components broken down by evaluation metric, target type, and forecast week; each point is an average of cross-validation evaluations for all 11 locations, seasons 2010/2011 to 2015/2016, and all targets of the given target type; data from the appropriate ILINet reports is used as input for the left-out seasons, while finalized wILI is used for the training seasons. Top half: log score evaluations (higher is better); bottom half: mean absolute error, normalized by the standard deviation of each target (lower is better). Left side: full Delphi-Stat ensemble, which includes additional methods not listed in thelegend; right side: ensemble of the three methods listed in the legend, plus a uniform distribution component for distributional forecasts. Many components of the full ensemble are not displayed. The “Targets, uniform” method is excluded from any mean absolute error plots as it was not incorporated into the point prediction ensembles.
Fig 7
Fig 7. Using finalized data for evaluation leads to optimistic estimates of performance, particularly for seasonal targets, “backcasting” improves predictions for seasonal targets, and nowcasting can improve predictions for short-term targets.
Mean log score of the extended delta density method, averaged across seasons 2010/2011 to 2015/2016, all locations, all targets, and forecast weeks 40 to 20, both broken down by target and averaged across all targets (“Overall”). Rough standard error bars for the mean score for each target (or overall) appear on the right, in addition to the error bars at each epi week.

References

    1. World Health Organization. WHO | Influenza (Seasonal); 2016. Available from: http://www.who.int/mediacentre/factsheets/fs211/en/.
    1. Centers for Disease Control and Prevention, National Center for Immunization and Respiratory Diseases (NCIRD). Estimating Seasonal Influenza-Associated Deaths in the United States | Seasonal Influenza (Flu) |CDC; 2016. Available from: https://www.cdc.gov/flu/about/disease/us_flu-related_deaths.htm.
    1. Thompson M, Shay D, Zhou H, Bridges C, Cheng P, Burns E, et al. Estimates of deaths associated with seasonal influenza—United States, 1976-2007. Morbidity and Mortality Weekly Report. 2010;59(33):1057. - PubMed
    1. Rolfes M, Foppa I, Garg S, Flannery B, Brammer L, Singleton J, et al. Estimated Influenza Illnesses, Medical Visits, Hospitalizations, and Deaths Averted by Vaccination in the United States; 2016. https://www.cdc.gov/flu/about/disease/2015-16.htm.
    1. Centers for Disease Control and Prevention, National Center for Immunization and Respiratory Diseases (NCIRD). Pandemic Influenza | Pandemic Influenza (Flu) | CDC; 2017. https://www.cdc.gov/flu/pandemic-resources/.

Publication types