Clinical Trial
. 2018 Jun 15;13(6):e0196916.
doi: 10.1371/journal.pone.0196916. eCollection 2018.

Activation recovery interval imaging of premature ventricular contraction

Affiliations
Clinical Trial

Activation recovery interval imaging of premature ventricular contraction

Ting Yang et al. PLoS One. .

Abstract

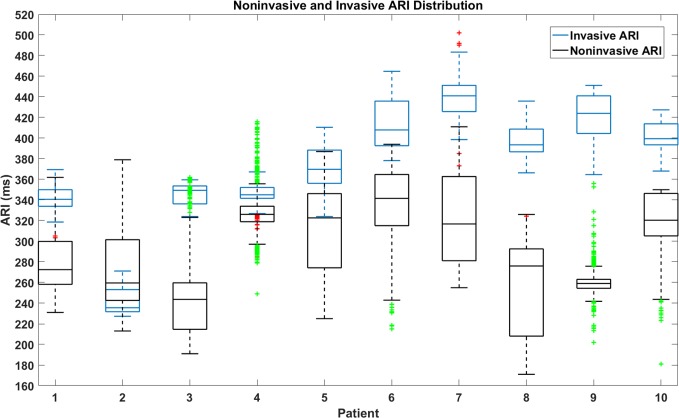
Dispersion of ventricular repolarization due to abnormal activation contributes to the susceptibility to cardiac arrhythmias. However, the global pattern of repolarization is difficult to assess clinically. Activation recovery interval (ARI) has been used to understand the properties of ventricular repolarization. In this study, we developed an ARI imaging technique to noninvasively reconstruct three-dimensional (3D) ARI maps in 10 premature ventricular contraction (PVC) patients and evaluated the results with the endocardial ARI maps recorded by a clinical navigation system (CARTO). From the analysis results of a total of 100 PVC beats in 10 patients, the average correlation coefficient is 0.86±0.05 and the average relative error is 0.06±0.03. The average localization error is 4.5±2.3 mm between the longest ARI sites in 3D ARI maps and those in CARTO endocardial ARI maps. The present results suggest that ARI imaging could serve as an alternative of evaluating global pattern of ventricular repolarization noninvasively and could assist in the future investigation of the relationship between global repolarization dispersion and the susceptibility to cardiac arrhythmias.


Conflict of interest statement

The authors have declared that no competing interests exist.

Figures

Fig 1
Fig 1. Schematic diagram of ARI imaging and validation in PVC patients.
(a): Experimental recordings include cross-sectional CT slices showing detailed heart geometry and torso boundaries, butterfly plot of multiple-channel ECGs and local activation time maps recorded during EP study. (b): Realistic heart-torso model (blue dots showing body surface electrodes). (c): Endocardial surface of ARI maps by applying ARI imaging. (d): ARI extraction of individual recording sites from unipolar electrograms. (e): Interpolated endocardial surface of ARI maps from CARTO system. 3D = 3-dimensional; ARI = activation recovery interval; CT = computed tomographic; ECG = electrocardiogram; EP = electrophysiology; LV = left ventricle; PVC = premature ventricular contraction; RV = right ventricle.
Fig 2
Fig 2. ARI extraction from unipolar electrograms.
Top: Unipolar electrogram (M1) of a recording site. Middle: First derivative of the top panel. Bottom: Simultaneous recording of Lead II by CARTO system. Amplitude unit of recordings is mV, and time unit is second. ARI = activation recovery interval; PVC = premature ventricular contraction.
Fig 3
Fig 3. Results with recording sites covering a full chamber.
First column: Imaged activation time maps. Second column: Endocardial surface of 3D ARI maps. Third column: Three cross section views of 3D ARI maps. Fourth column: Interpolated CARTO ARI maps. Yellow stars in the ARI maps represent the longest ARI sites. All the maps were color-coded from red to blue. 3D = 3-dimensional; ARI = activation recovery interval; CC = correlation coefficient; LE = localization error; LV = left ventricle; RV = right ventricle.
Fig 4
Fig 4. Results with fewer recording sites covering regional ventricles.
The format is the same as in Fig 1. 3D = 3-dimensional; ARI = activation recovery interval; CC = correlation coefficient; LE = localization error; LV = left ventricle; max = maximum; min = minimum; RV = right ventricle.
Fig 5
Fig 5. Extracted ARI distribution from CARTO recorded unipolar electrograms (blue) and Imaged ARI distribution (black).
Fig 6
Fig 6. Scatter plot between normalized CARTO ARI and estimated ARI.
Linear regression parameters are shown for the fitted line plotted.
Fig 7
Fig 7. Plots of CARTO-recorded Lead II of PVC beats from ten endocardial recording sites and ten analyzed PVC beats on body surface Lead II.
PVC = Premature Ventricular Contraction.

References

    1. Laurita KR, Girouard SD, Akar FG, Rosenbaum DS. Modulated dispersion explains changes in arrhythmia vulnerability during premature stimulation of the heart. Circulation. 1998;98: 2774–2780. - PubMed
    1. Gambardella J, Trimarco B, Iaccarino G, Santulli G. New insights in cardiac calcium handling and excitation-contraction coupling. 2017; - PMC - PubMed
    1. Han J, Moe GK. Nonuniform recovery of excitability in ventricular muscle. Circ Res. 1964;14: 44–60. - PubMed
    1. Han J, Millet D, Chizzonitti B, Moe GK. Temporal dispersion of recovery of excitability in atrium and ventricle as a function of heart rate. Am Heart J. 1966;71: 481–487. - PubMed
    1. Chauhan VS, Downar E, Nanthakumar K, Parker JD, Ross HJ, Chan W, et al. Increased ventricular repolarization heterogeneity in patients with ventricular arrhythmia vulnerability and cardiomyopathy: a human in vivo study. Am J Physiol-Heart Circ Physiol. 2006;290: H79–H86. doi: 10.1152/ajpheart.00648.2005 - DOI - PubMed

Publication types