. 2018 Jun 14;173(7):1593-1608.e20.
doi: 10.1016/j.cell.2018.05.006.

Prospectively Isolated Tetraspanin+ Neoblasts Are Adult Pluripotent Stem Cells Underlying Planaria Regeneration

Affiliations

Prospectively Isolated Tetraspanin+ Neoblasts Are Adult Pluripotent Stem Cells Underlying Planaria Regeneration

An Zeng et al. Cell. .

Abstract

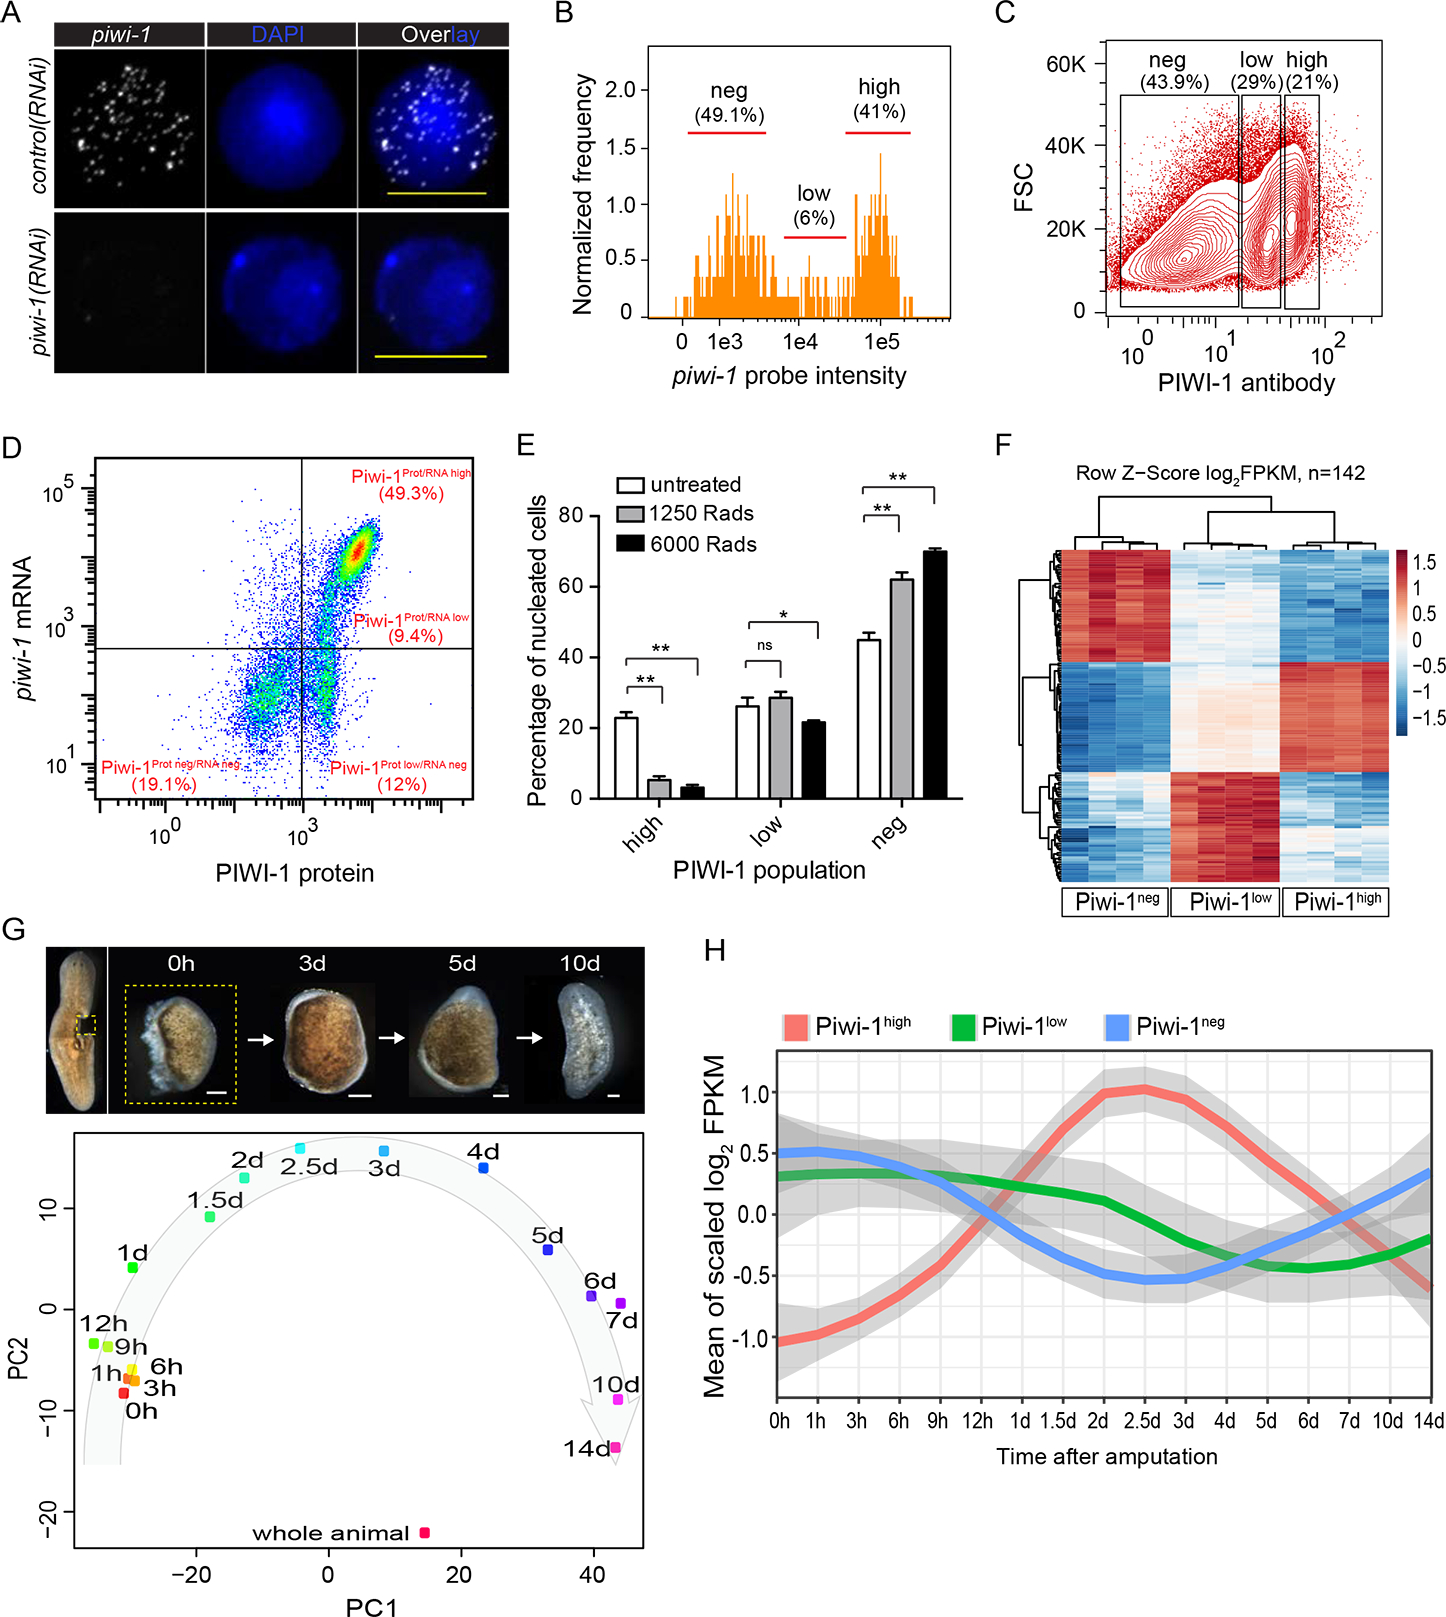
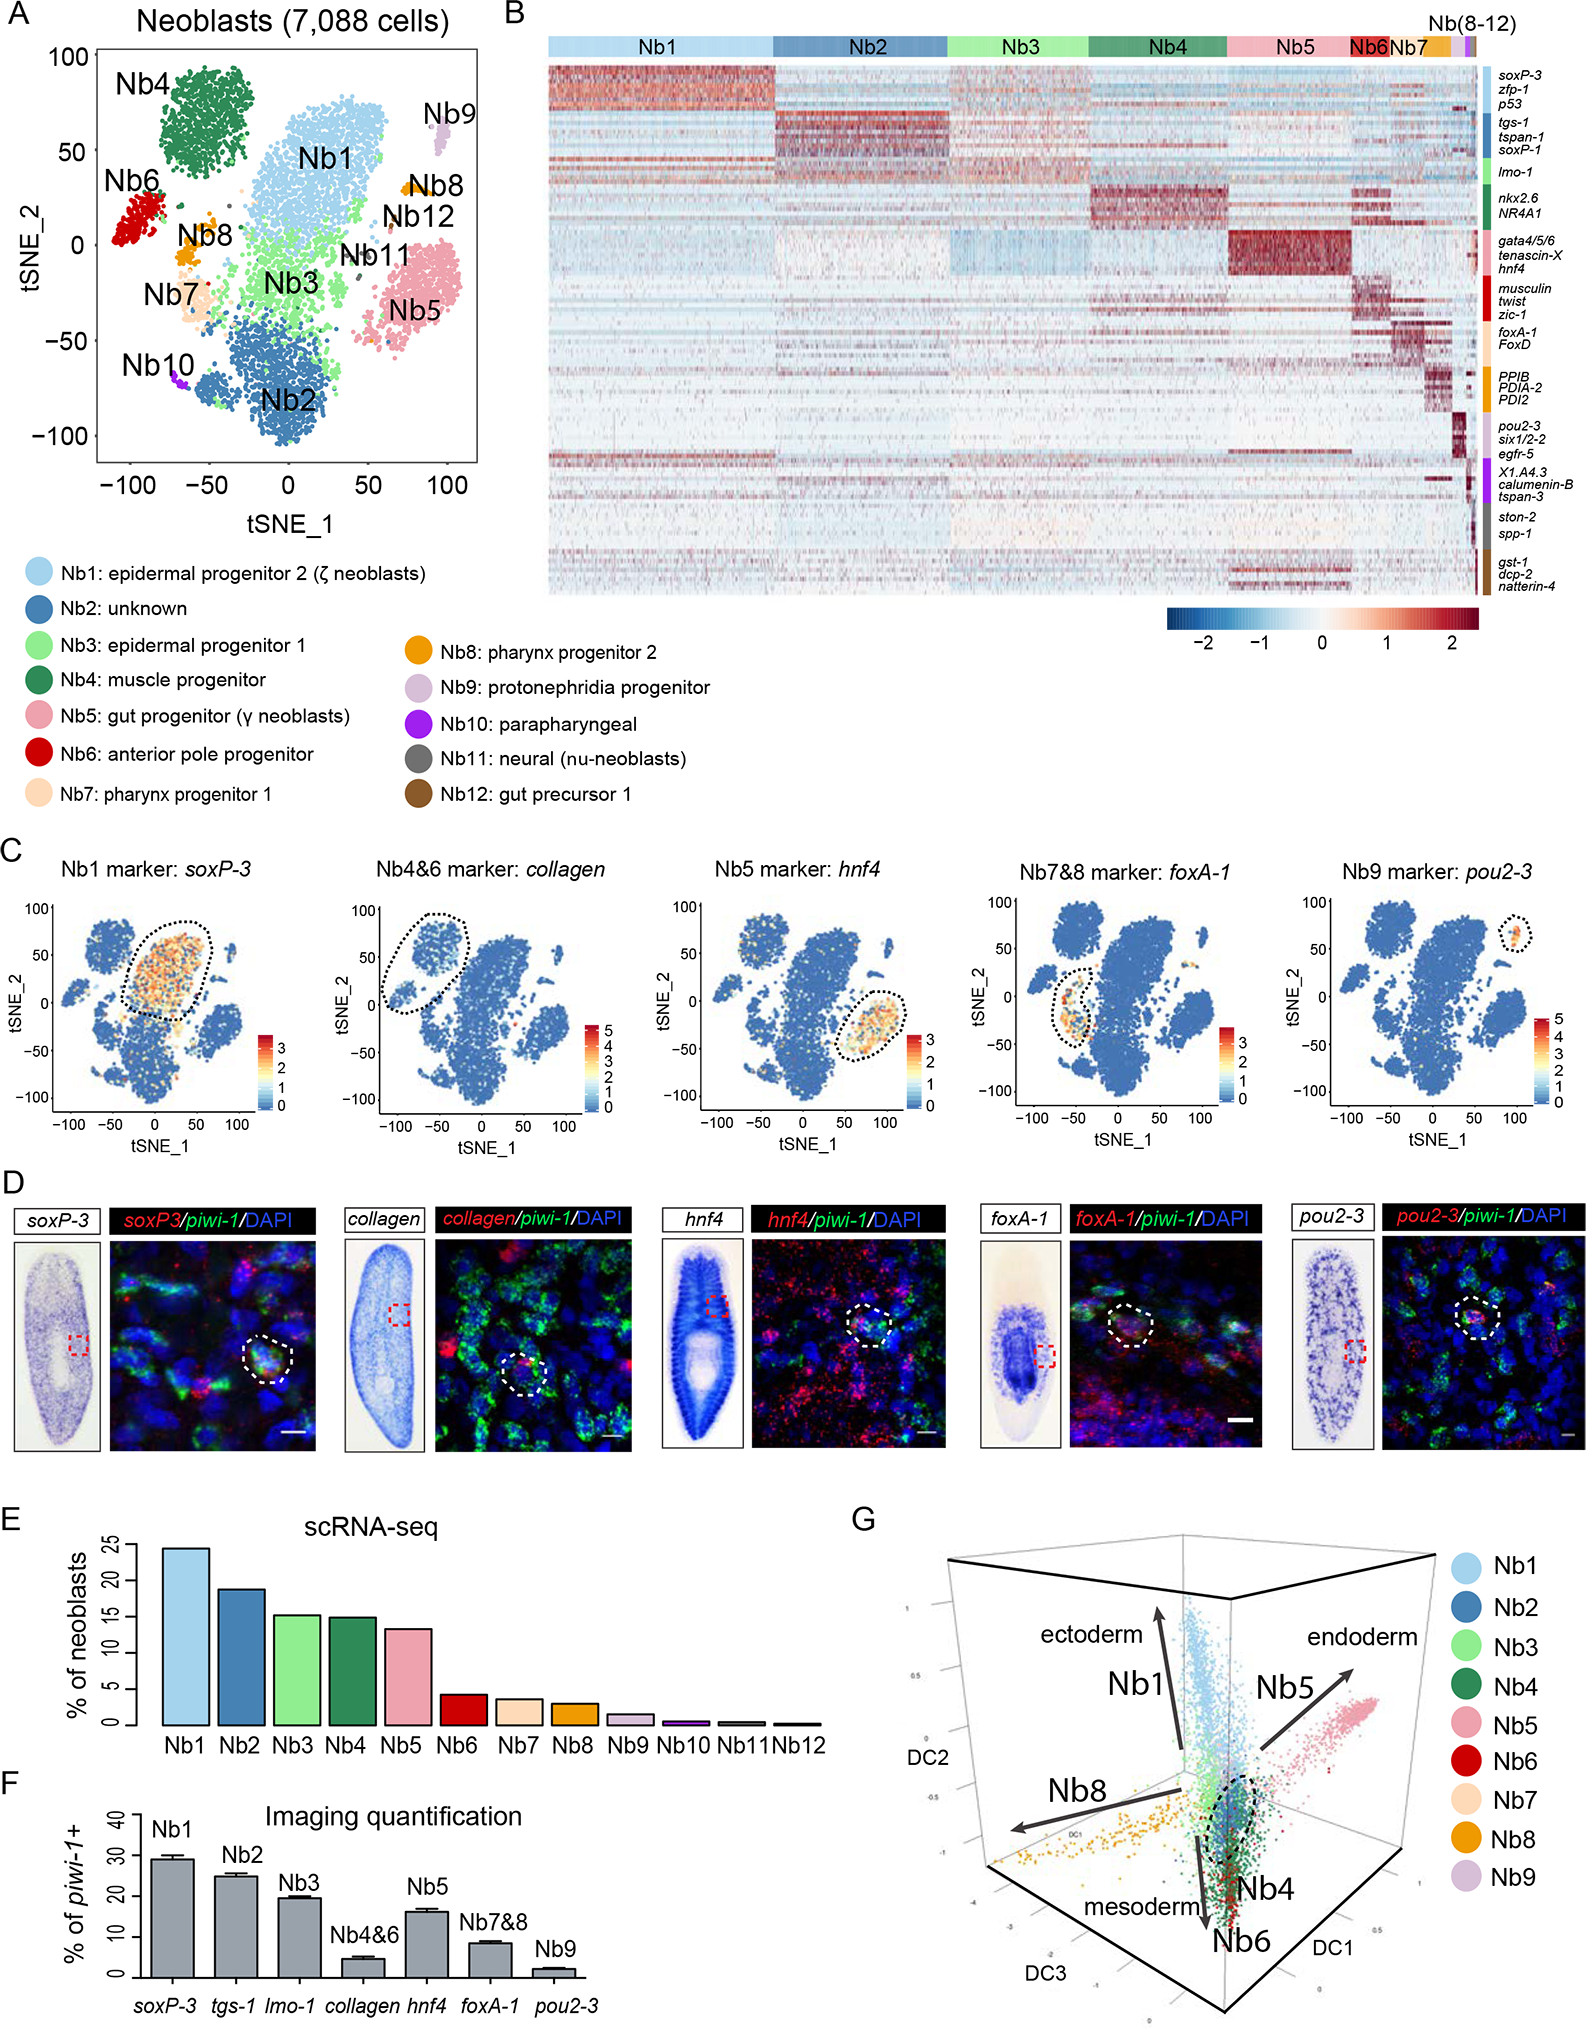
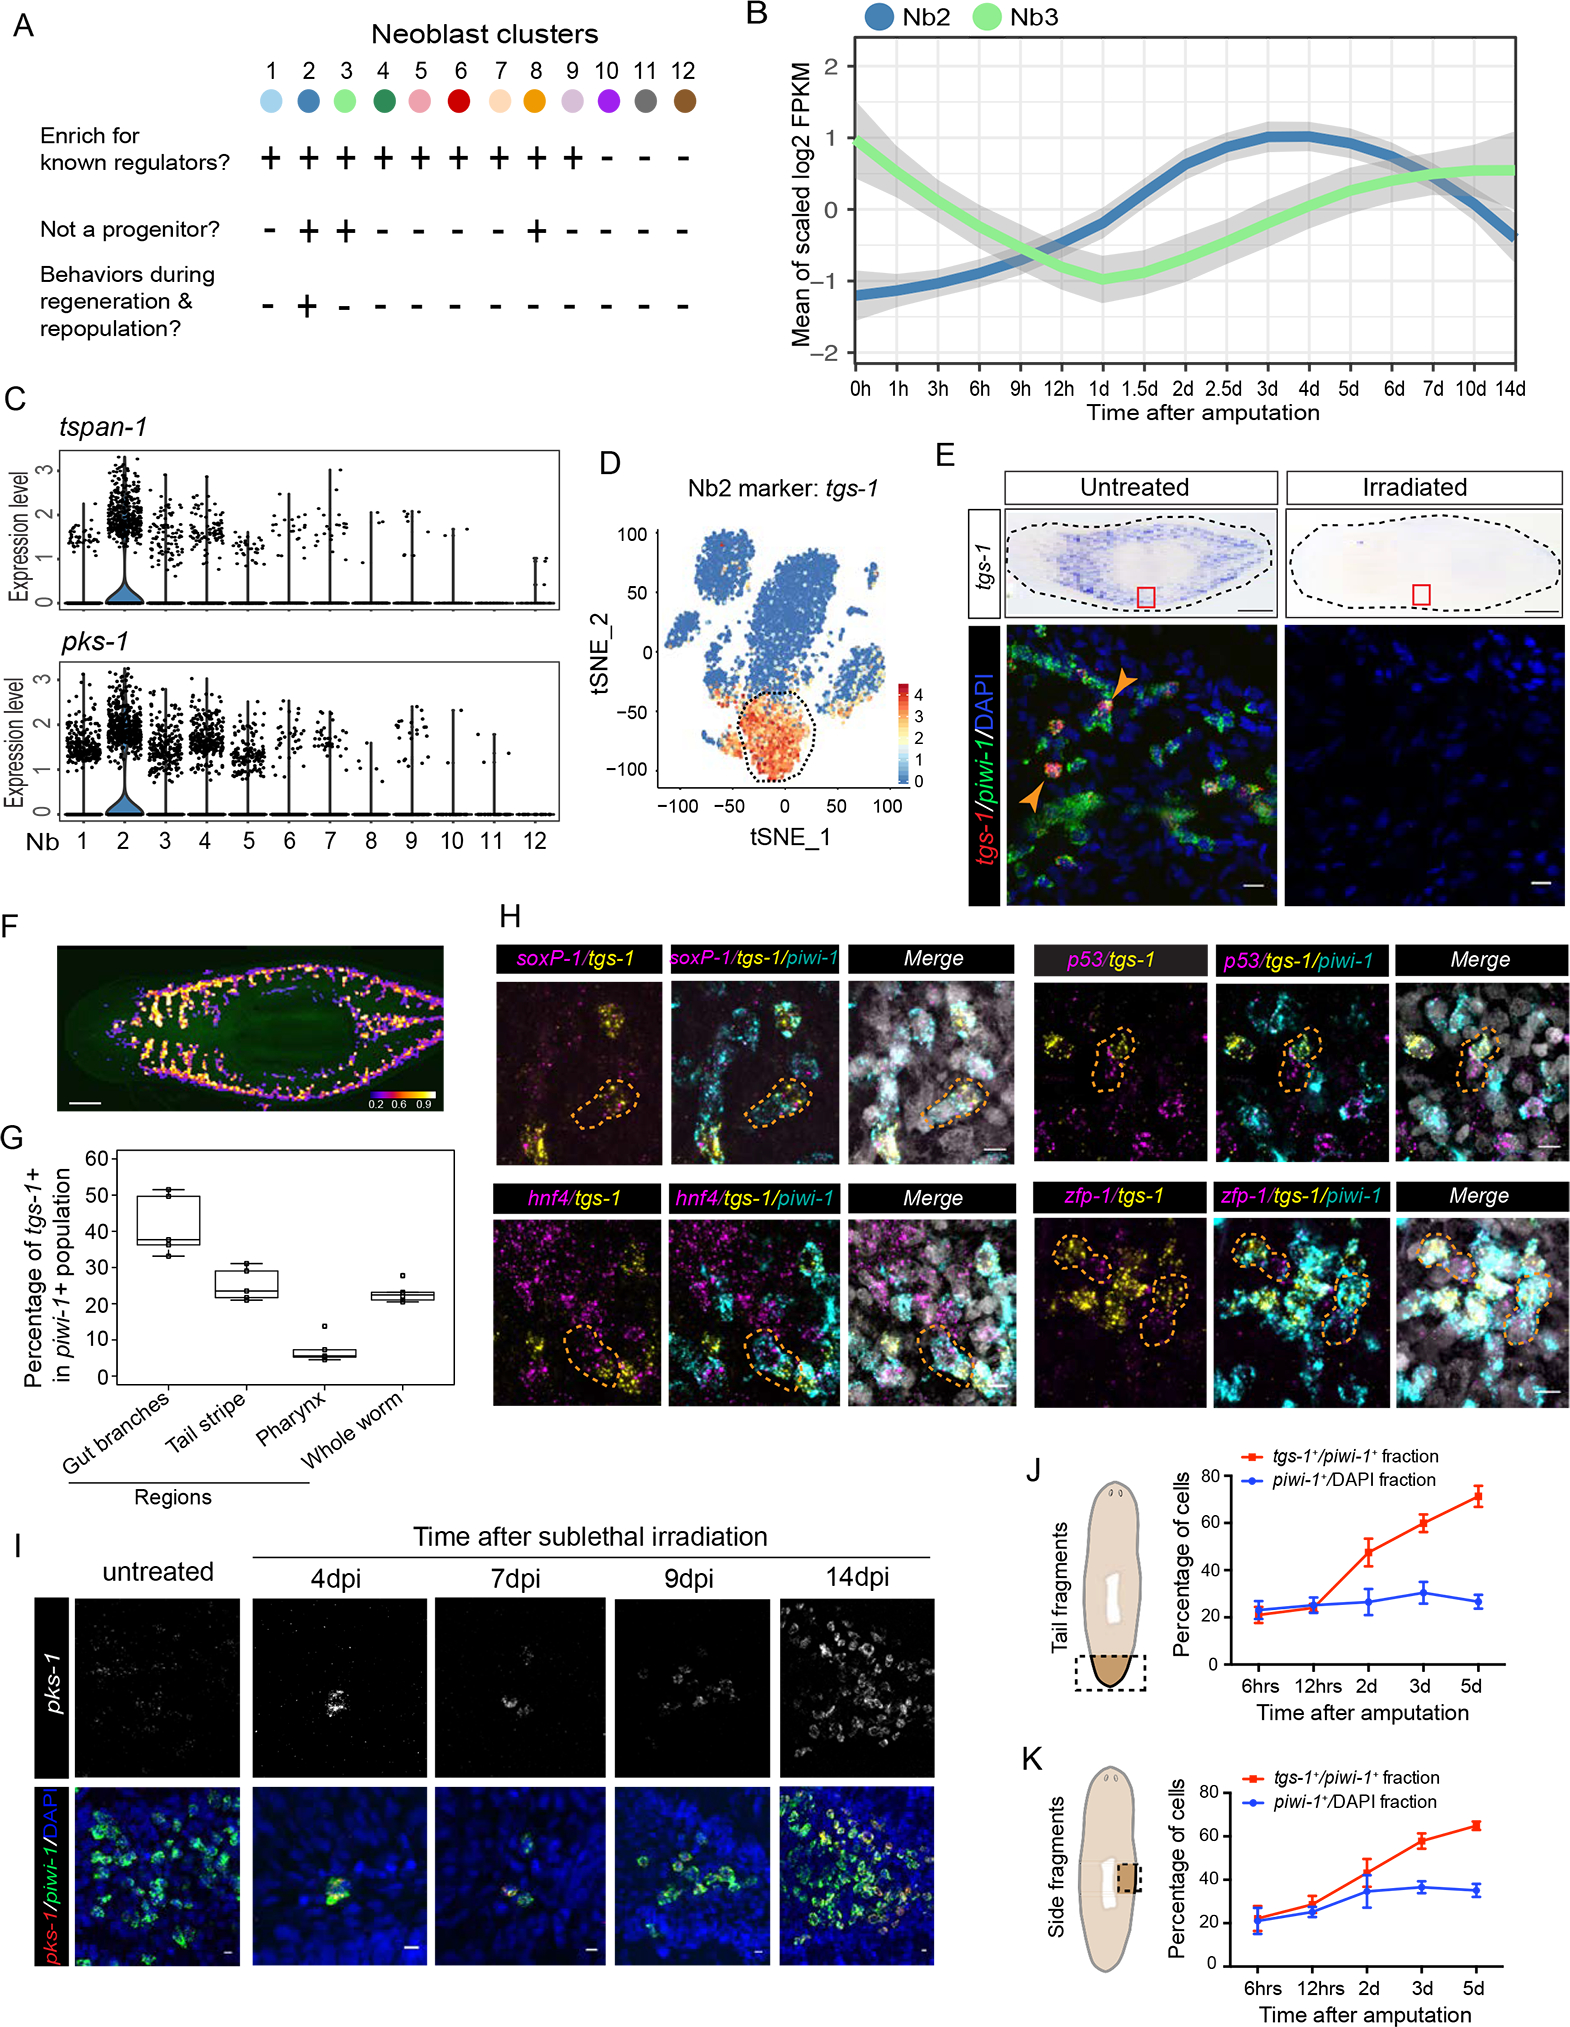
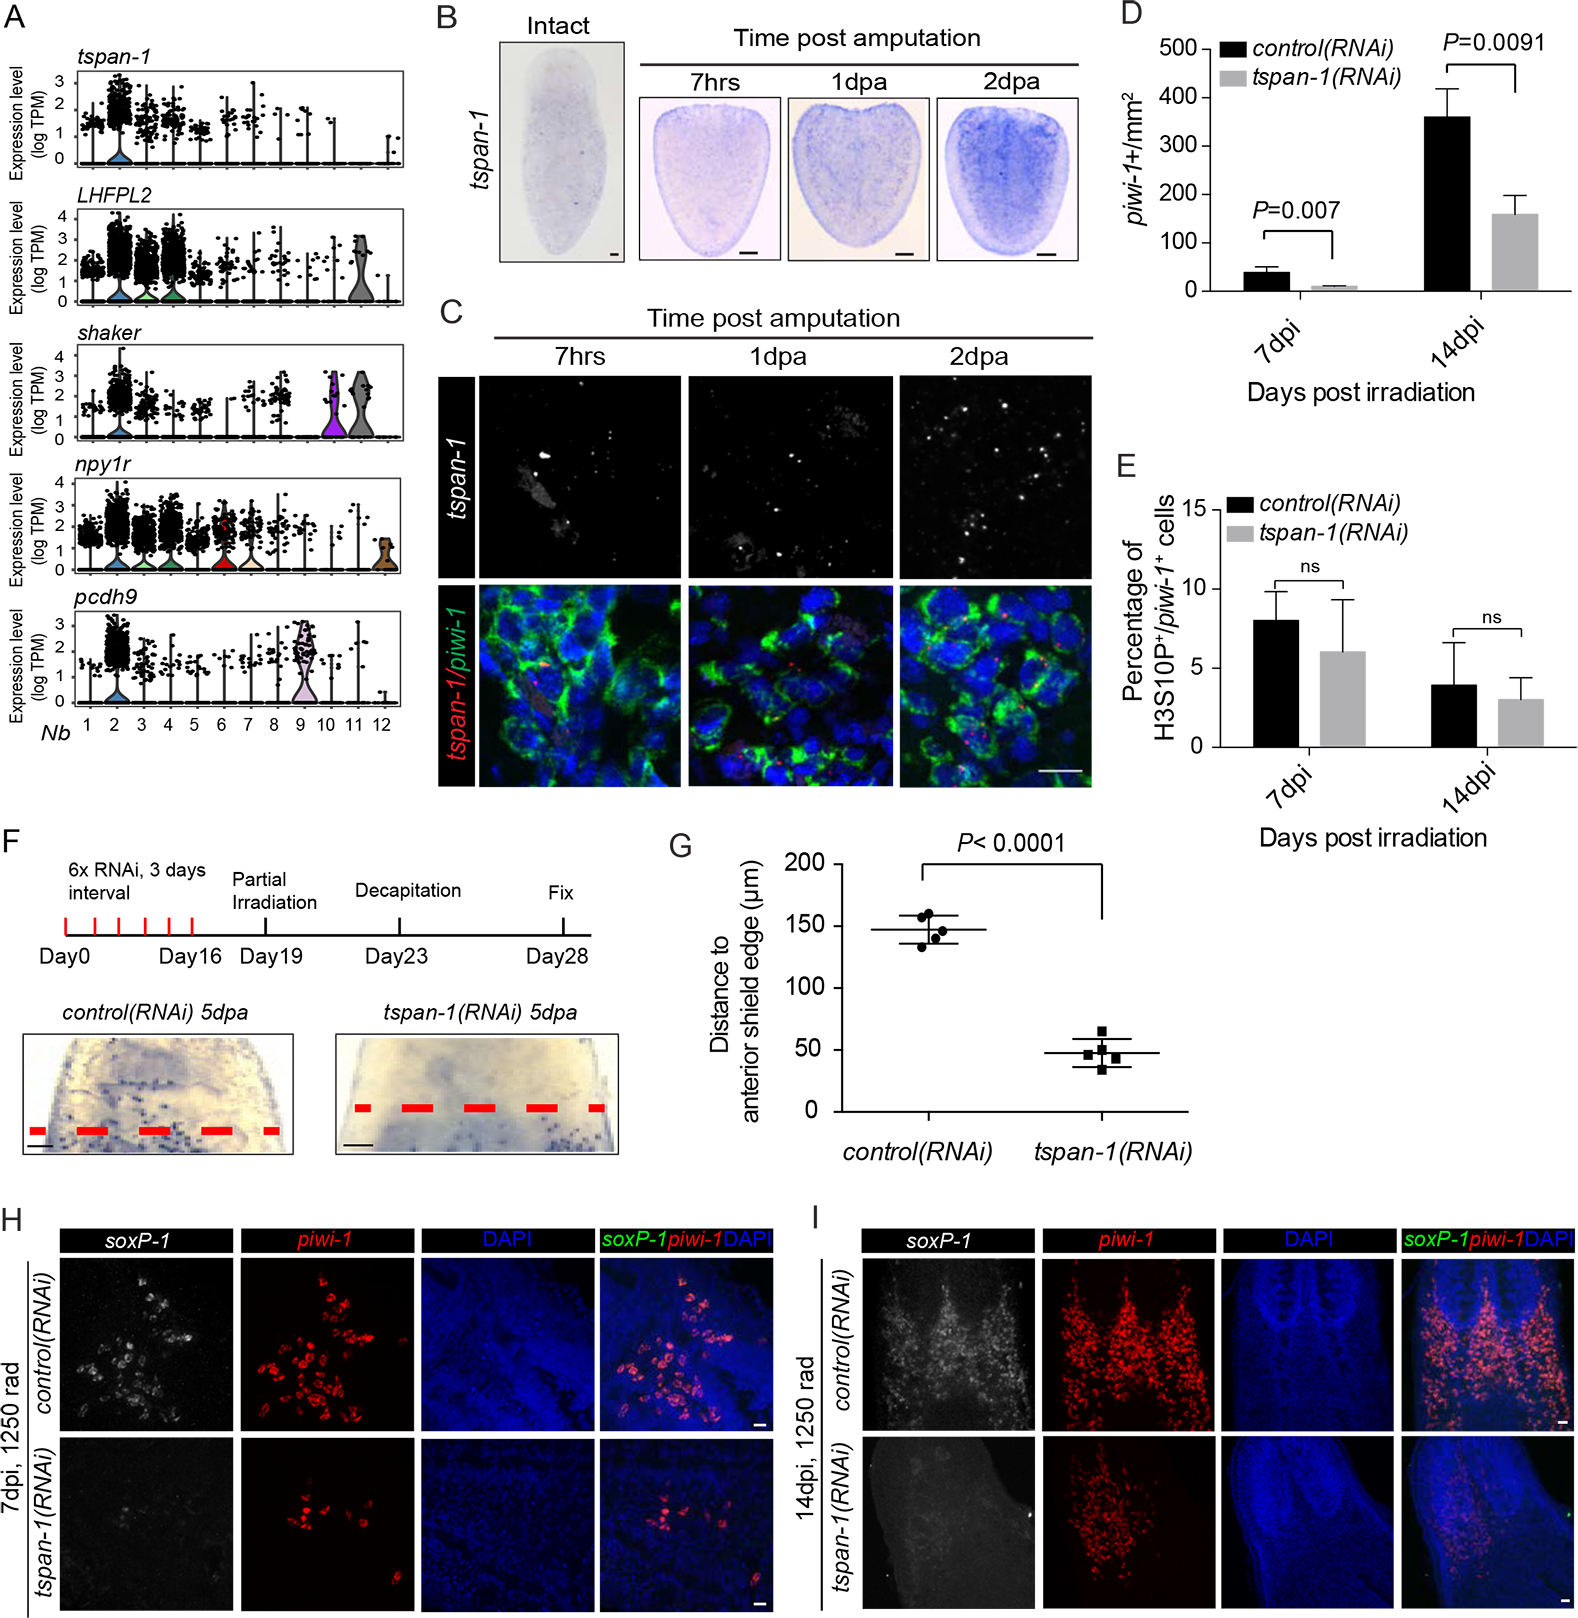
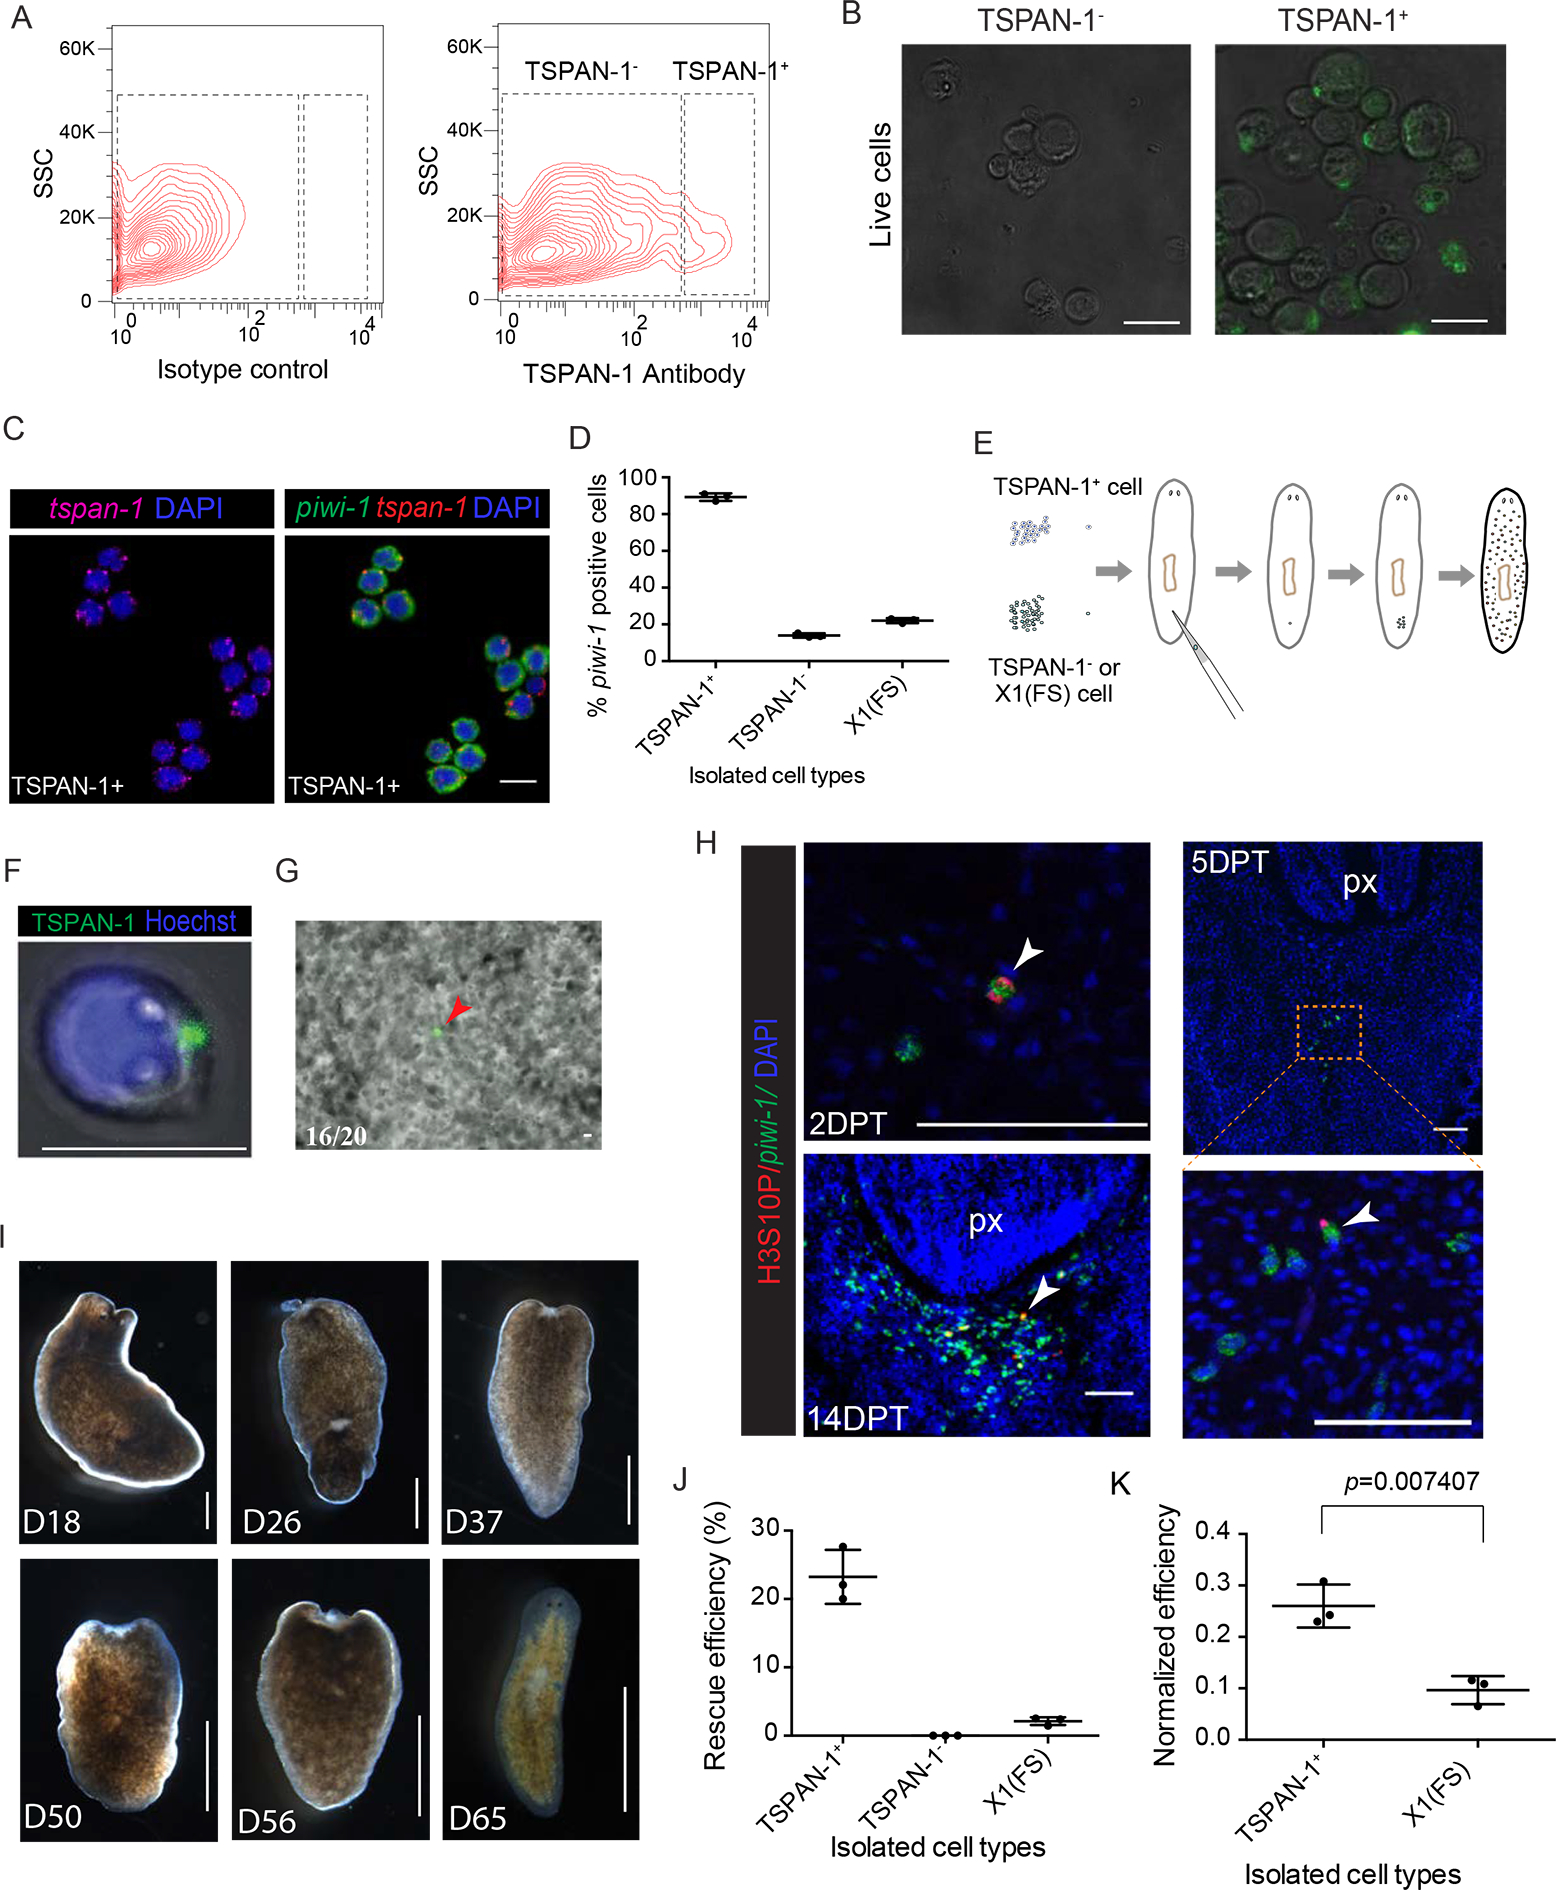
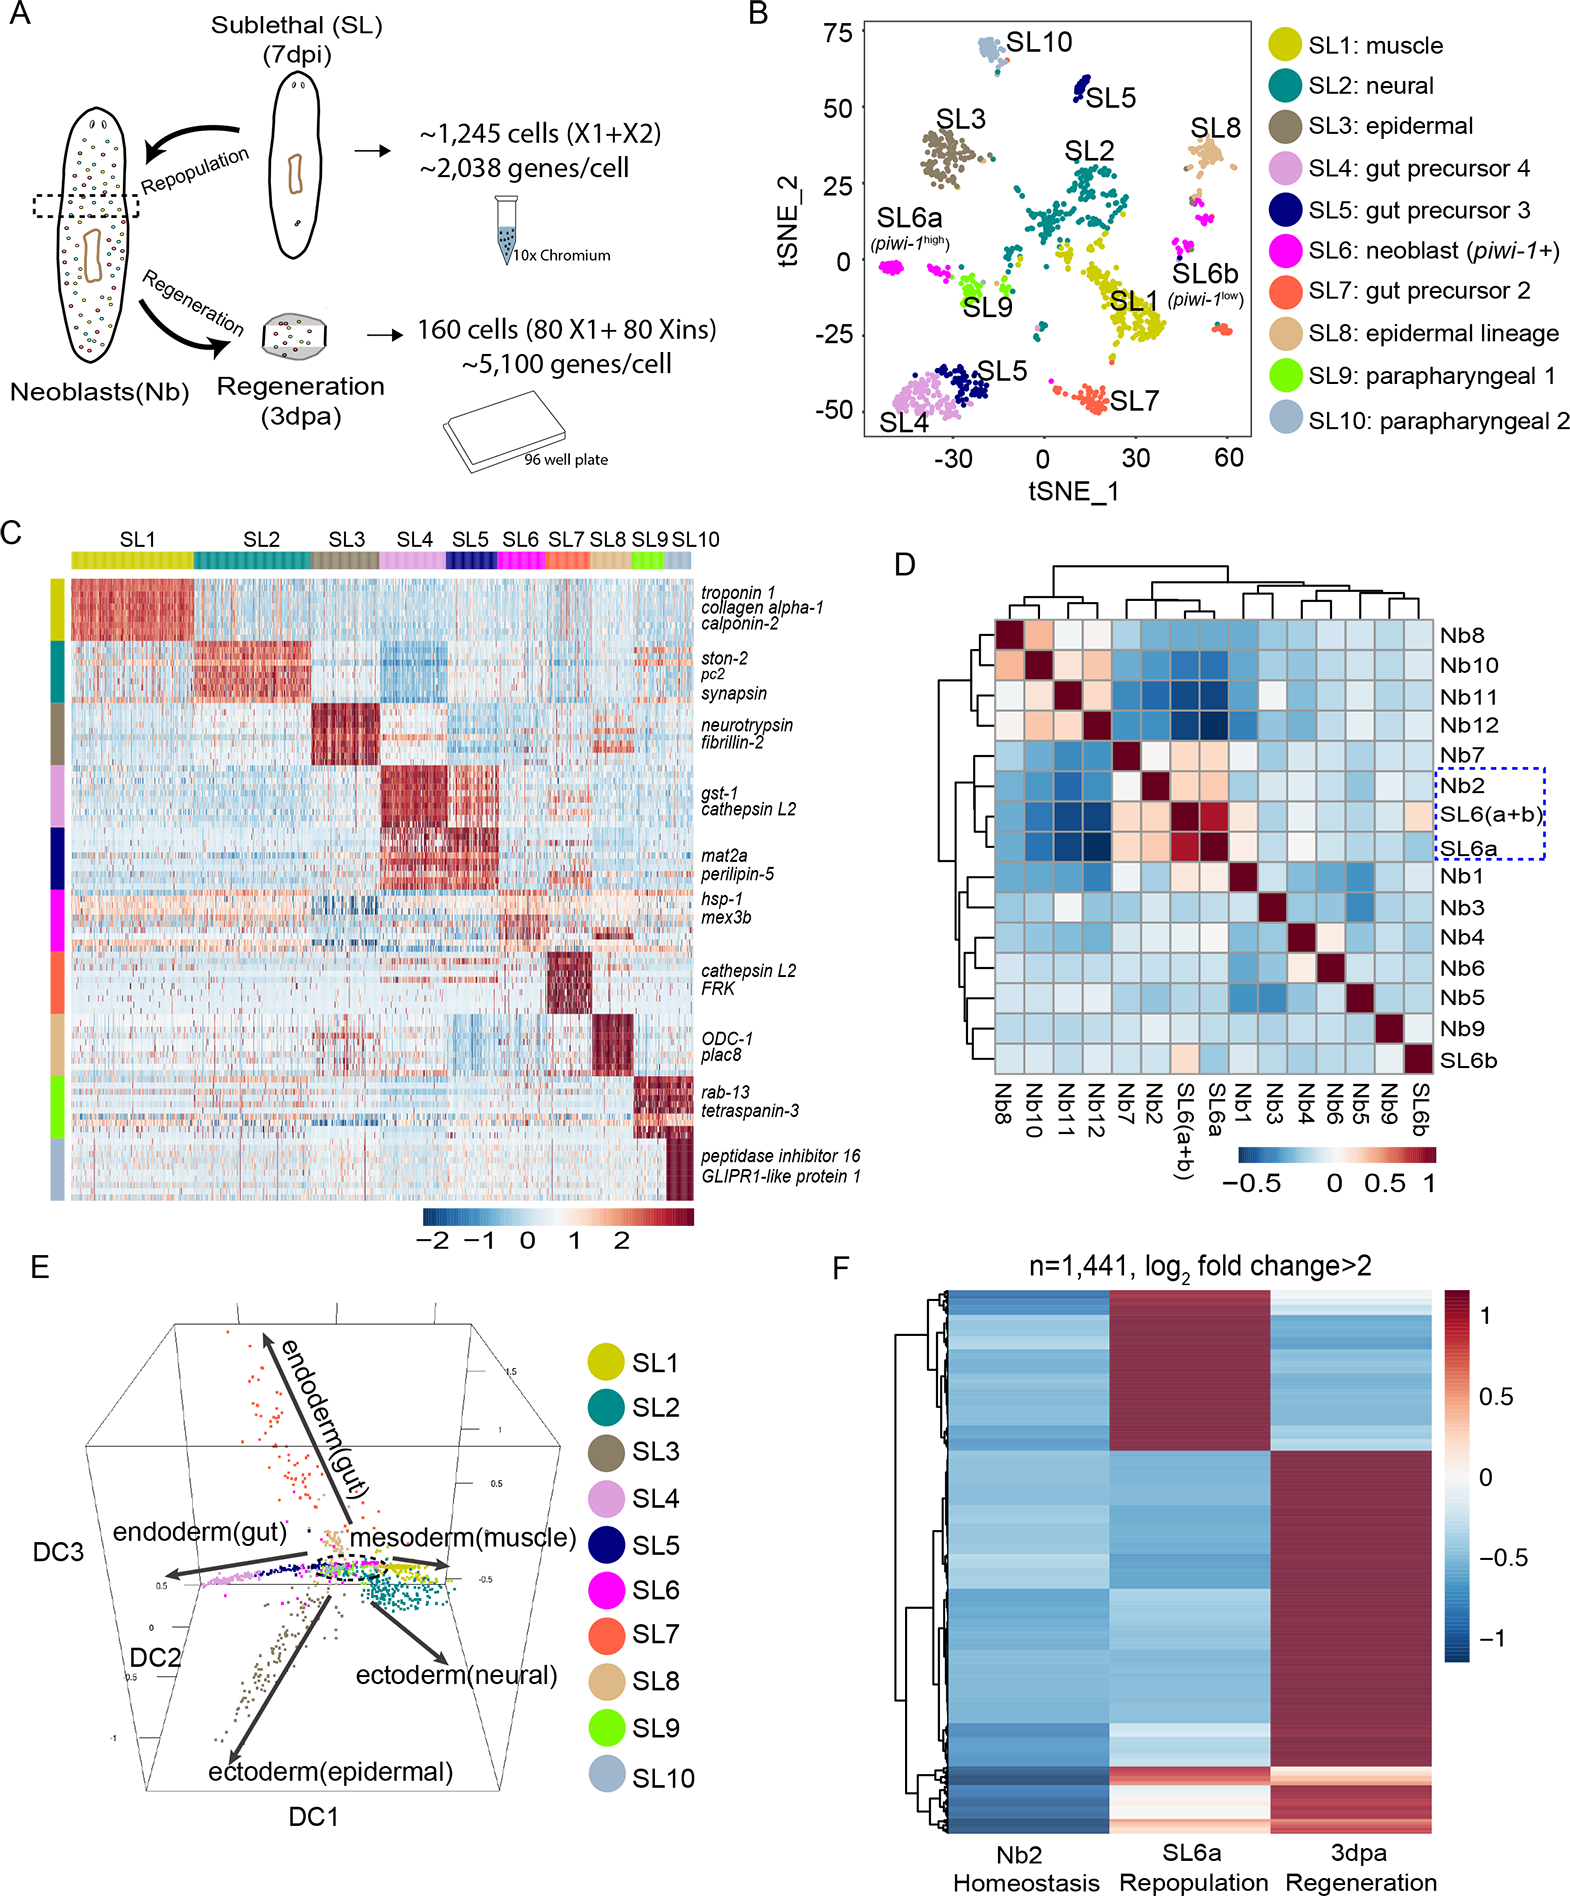
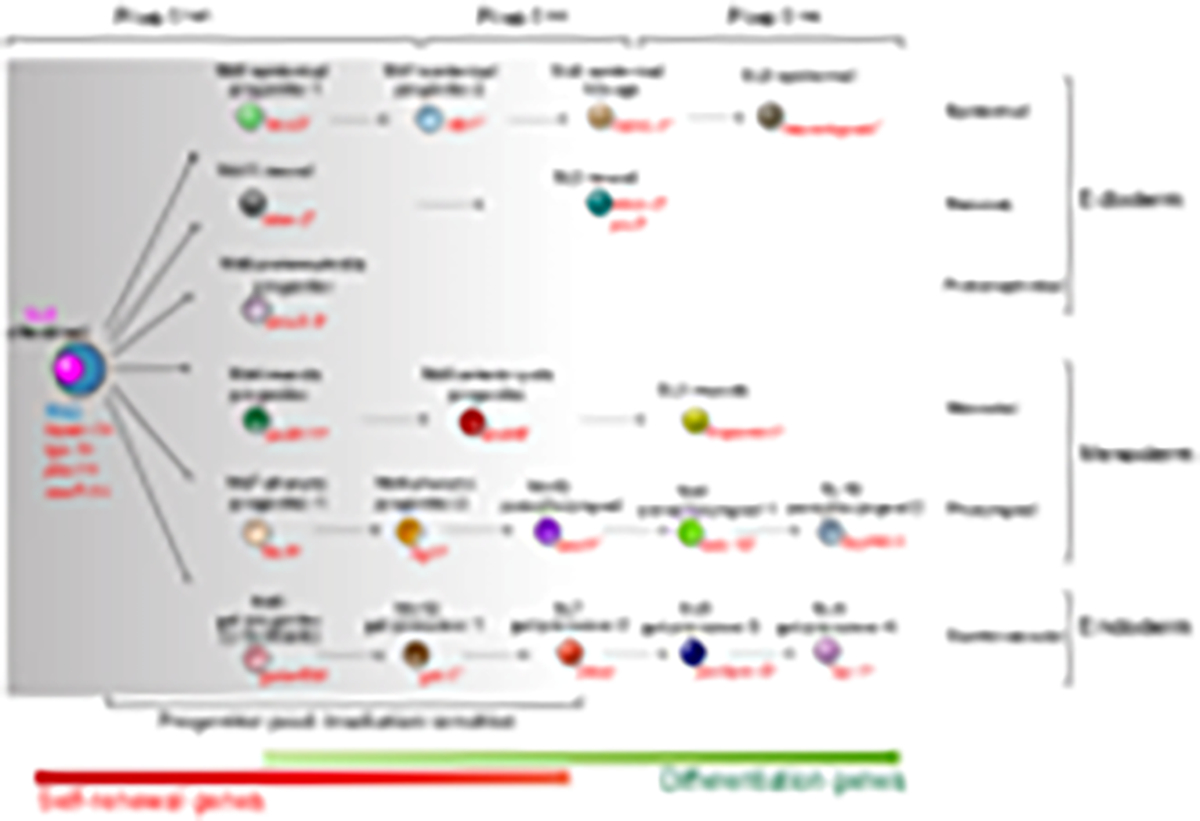
Proliferating cells known as neoblasts include pluripotent stem cells (PSCs) that sustain tissue homeostasis and regeneration of lost body parts in planarians. However, the lack of markers to prospectively identify and isolate these adult PSCs has significantly hampered their characterization. We used single-cell RNA sequencing (scRNA-seq) and single-cell transplantation to address this long-standing issue. Large-scale scRNA-seq of sorted neoblasts unveiled a novel subtype of neoblast (Nb2) characterized by high levels of PIWI-1 mRNA and protein and marked by a conserved cell-surface protein-coding gene, tetraspanin 1 (tspan-1). tspan-1-positive cells survived sub-lethal irradiation, underwent clonal expansion to repopulate whole animals, and when purified with an anti-TSPAN-1 antibody, rescued the viability of lethally irradiated animals after single-cell transplantation. The first prospective isolation of an adult PSC bridges a conceptual dichotomy between functionally and molecularly defined neoblasts, shedding light on mechanisms governing in vivo pluripotency and a source of regeneration in animals. VIDEO ABSTRACT.

Keywords: planaria; pluripotent; prospective isolation; regeneration; single cell transplantation; stem cells; tetraspanin.


Conflict of interest statement

DECLARATION OF INTERESTS

The authors declare no competing interests.

Figures

Figure 1.
Figure 1.. Piwi-1 mRNA and protein measurements in neoblast populations
(A) Super resolution images of FISH staining of piwi-1 transcripts on single X1 cells from control or piwi-1(RNAi) animals. Representative cells shown. n>10 for each condition. Scale bar, 10 μm. (B) piwi-1 transcript distribution by ImageStream flow cytometric analysis. piwi-1 high cells, high; piwi-1 low cells, low; piwi-1 negative cells, neg. Positive cell population determined by distribution of negative control probe stained cells shown in S1A. Representative of 3 independent experiments shown. (C) PIWI-1 antibody intracellular staining followed by flow cytometric analyses. PIWI-1 high cells, high; PIWI-1 low cells, low; PIWI-1 negative cells, neg. Representative of more than 3 independent experiments shown. (D) Representative FACS plot and frequency of pre-sorted cells after co-staining with piwi-1 probe and PIWI-1 antibody. Positive cell population determined by distribution of negative control probe or isotype antibody stained cells shown in S1F. Representative of 3 independent experiments shown. (E) Comparison of PIWI-1 signal levels in cells from planarian 1-day after treatment with different irradiation dosages. Each column represents percent of indicated cells on total nucleated cells. Error bars: SD. **p-value <0.001, *p-value <0.05. (F) Differential expression heatmap of signature genes for Piwi-1high, Piwi-1low and Piwi-1neg populations. Shown are log2FPKM with row scaled (z-score) based on RNA-seq data of cell populations shown in (C). Shown are 142 genes enriched for each cell population (Table S1). (G) Principal component analysis (PCA) of all regeneration time points profiled. Data were from time-course of small tissue fragments undergoing a full cycle of whole-body regeneration. Each dot represents the average of 4 replicates. Scale bar, 100 μm. (H) Dynamic changes of signature genes specifically expressed in each of the three PIWI-1 groups (shown in F) over the RNA-seq of whole-body regeneration time courses. See also Figs. S1, S2; Table S1.
Figure 2.
Figure 2.. Single cell RNA-seq resolves the cellular complexity of Piwi-1high cells.
(A) t-SNE plot shows two-dimensional representation of global gene expression relationships among all neoblasts (n=7,088 after filter). Cluster identity was assigned based on the top 10 marker genes of each cluster (Table S2), followed by inspection of RNA in situ hybridization patterns. Neoblast groups, Nb. (B) Scaled expression heatmap of discriminative gene sets for each cluster defined in (A). Color scheme shows z-score distribution from −2.5 (Blue) to 2.5 (Red). Right margin color bars highlight gene sets specific to respective Nb cluster. (C-D) Neoblast cluster marker expression in the t-SNE clustered cells (C). Representative images of Whole-mount In Situ Hybridization (WISH) (left) and multiplex FISH (right) for common neoblast marker (piwi-1) and five major Nb cluster markers (D). White-dashed shapes outline piwi-1+ cells that co-express different cell cluster markers. Scale bar, 10 μm. (E) Percentage of each neoblast cluster (C) by single-cell RNA-seq. (F) Percentage Quantification of co-FISH of indicated marker gene with piwi-1 shown in panel (D) for each Nb cluster. Error bar, SD; n>3 animals for each cell cluster marker. (G) Neoblast and progenitor cell cluster visualization using first three components of diffusion map. Cells colored by t-SNE clusters. 4 main branches are indicated with solid arrows, and two sets of clusters at root are circled with dashed lines. Nb10 through Nb12 were not included due to low cell number. See also Fig. S3; Movie S1; Table S2.
Figure 3.
Figure 3.. Nb2 is a novel Piwi-1high neoblast group possessing pluripotent cell properties
(A) Criteria for identifying cell cluster(s) associated with pluripotency properties. (B) Nb2 and Nb3 signature gene expression is dynamic during RNA-seq regeneration time-course shown in Fig. 1G. (C) Violin plots show distribution of expression levels for two Nb2 marker genes in cells (dots) of each of the 12 neoblast clusters. (D) Expression of tgs-1 in t-SNE clustered cells. (E) Representative WISH of tgs-1 in response to irradiation (top) and double-labeled FISH for tgs-1 and piwi-1 mRNA expression (bottom). White arrowheads highlight subset of tgs-1+ and piwi-1+ cells. Representative animals shown, n>6 for each condition. Scale bars, 250 μm for WISH data (top row), and 10 μm for FISH data (bottom row). (F) tgs-1 and piwi-1 mRNA co-expression heatmap. Color scale indicates percentage of piwi-1+ cells that are also tgs-1+ across whole body. Scale bar, 250 μm. (G) tgs-1+ cell quantification in (F) indicates enrichment proximal to gut branches but removed from pharyngeal region. (H) Triple FISH of piwi-1, tgs-1 and known neoblast-class markers, soxP-1 (σ neoblast), p53 and zfp-1 (ζ neoblasts), and hnf4 (γ neoblasts). Orange-dashed shapes outline two neighboring piwi-1+ cells each expressing different level of tgs-1 and known neoblast markers. Scale bar, 10 μm. (I) pks-1 with piwi-1 coexpression time-course after sublethal (1,250 rads) irradiation. Scale bar, 10 μm. (J and K) Quantification of tgs-1 and piwi-1 coexpression during regeneration time-courses of either whole tail fragments (J) or whole side fragments (K) as shown in illustrations (dashed rectangle insets). Roughly 48.5K to 1 million cells from 4–8 animals were quantified for (J); and 14K to 68.3K cells from 2–4 animals were quantified for (K). See also Fig. S4.
Figure 4.
Figure 4.. RNAi depletion of Nb2 marker genes affects Nb2 cell repopulation and mobilization after sublethal and partial irradiation
(A) Violin plots show distribution of expression levels for each of top-five predicted cell-surface protein coding genes enriched in Nb2 group. (B) tspan-1 temporal expression assessed by in situ hybridization in tail fragments post amputation. Representative animals shown, n>5 for each condition. Scale bar, 100 μm. (C) Double-labeled FISH using RNAscope for piwi-1 and tspan-1 mRNA in tail fragments fixed 7 hours (7hrs), 1-day, and 2-day post-amputation (dpa). Representative areas shown. n≥ 5 animals per condition. Scale bar, 10 μm. (D-E) Quantification of piwi-1+ cells (D) and mitotic index (E) in control(RNAi) and tspan-1(RNAi) animals at indicated time points after sub-lethal irradiation. Error bar, SD. (F-G) Cell dispersion assessed by piwi-1 staining (E) and quantified at anterior boundaries in decapitated animals at 9dpi, corresponding to 5 dpa. Representative animals shown. n≥5 animals per condition. Error bar, SD. Scale bar, 100 μm. (H and I) tspan-1(RNAi) knockdown impairs σ-class cell repopulation after sub-lethal irradiation. Representative areas shown. n≥5 animals per condition. Scale bar, 10 μm. See also Fig. S5.
Figure 5.
Figure 5.. Single cell transplantation of single TSPAN-1 positive cell rescues lethally irradiated animals
(A) Flow cytometric analyses showing staining of TSPAN-1 antibody. Shown is a representative of more than 3 independent experiments. (B) Representative freshly sorted TSPAN-1 (left) and TSPAN-1+ (right) cells bright-field and fluorescence images. Scale bar, 10 μm. (C-D) Representative double FISH of piwi-1 and tspan-1 probes on sorted TSPAN-1+ cells (C). Scale bar, 10 μm. Comparison of percentage of piwi-1+ cells in the indicated isolated cell populations (D). (E) Single-cell transplantation assay. Sexual hosts were irradiated to eliminate all stem cells 2 days before transplantation. Individual cell was transplanted to assess repopulation/rescue efficiency. (F) Freshly sorted single TSPAN-1+ cell live imaging verified membrane localization of antibody signal. Cell shows obvious cytoplasmic processes. Shown are maximal projections of Movie S2. Scale bar, 10 μm. (G) Single transplanted cell live imaging immediately after single cell transplantation. Scale bar, 10 μm. (H) Colony formation assayed by mitotic marker H3S10P (red) and neoblast marker piwi-1 (green) at indicated time point after transplantation. Anterior, up. Ventral shown. Colonies of dividing piwi-1+ cells (arrowhead). px, pharynx. Scale bar, 100 μm. (I) Representative images of transplanted hosts at time points after single cell transplantation. Different animals shown in each panel. Scale bar, 1 mm. (J and K) Rescue efficiency quantification (J), and piwi-1+ percentage normalized efficiency (K). piwi-1+ percentage obtained from (D). See also Fig. S6; Movies S2, S3.
Figure 6.
Figure 6.. Response of pluripotent stem cells to regeneration and repopulation signals
(A) Comparison strategy of single-cell transcriptomic data from homeostatic, repopulation and regeneration conditions. Droplet-based 3’ or plate-based full-length scRNA-seq were used. (B) t-SNE plot of surviving X1 and X2 cells (n=1,039 after QC filter) after sub-lethal irradiation. Colors indicate unbiased cell classification via graph-based clustering. Sub-Lethal irradiated cell groups, SL. (C) Scaled expression heatmap of discriminative gene sets for each cluster defined in (B) Color scheme based on z-score distribution from −2.5 (Blue) to 2.5 (Red). Left margin color bars highlight gene sets (right side) specific to respective cell subsets. (D) Spearman rank correlation heatmap for all pairwise comparisons of indicated cell types. Spearman correlations were calculated using normalized read counts across the entire transcriptome (n=31,253 genes) for all RNA-seq experiments. (E) Neoblast and progenitor cell cluster visualization using diffusion map. Five main branches are indicated with solid arrows, with one cluster (SL6) sitting at the root (dashed lines). (F) Scaled expression heatmap of discriminative gene sets upregulated (Log2 fold change > 2) in regeneration (3dpa, tspan-1+ cells), repopulation (7dpi, SL6a cells) or both when compared to homeostatic Nb2 group. See also Fig. S7; Movie S4; and Table S3.
Figure 7.
Figure 7.. Proposed lineage composition model of planarian piwi-1+ cells.
12 major classes representing 6 cell lineages of all 3 germ layers were found in the neoblast compartment of adult planaria. Nb2 and SL6a can self-renew, and collectively give rise to a wide range of tissue types in single cell transplantation and repopulation, respectively. As differentiation ensues, piwi-1 expression is downregulated, and tissue-associated transcription factors upregulated.

Comment in

References

    1. Adler CE, Seidel CW, McKinney SA, and Sánchez Alvarado A (2014). Selective amputation of the pharynx identifies a FoxA-dependent regeneration program in planaria. Elife 3, e02238. - PMC - PubMed
    1. Boucheix C, and Rubinstein E (2001). Tetraspanins. Cell Mol Life Sci 58, 1189–1205. - PMC - PubMed
    1. Bullard JH, Purdom E, Hansen KD, and Dudoit S (2010). Evaluation of statistical methods for normalization and differential expression in mRNA-Seq experiments. BMC Bioinformatics 11, 94. - PMC - PubMed
    1. Cheng LC, Tu KC, Seidel CW, Robb SMC, Guo F, and Sánchez Alvarado A (2017). Cellular, ultrastructural and molecular analyses of epidermal cell development in the planarian Schmidtea mediterranea. Dev Biol. - PMC - PubMed
    1. Collins JJ 3rd, Hou X, Romanova EV, Lambrus BG, Miller CM, Saberi A, Sweedler JV, and Newmark PA (2010). Genome-wide analyses reveal a role for peptide hormones in planarian germline development. PLoS Biol 8, e1000509. - PMC - PubMed

Publication types

MeSH terms