

Time series model for forecasting the number of new admission inpatients
- PMID: 29907102
- PMCID: PMC6003180
- DOI: 10.1186/s12911-018-0616-8
Time series model for forecasting the number of new admission inpatients
Abstract
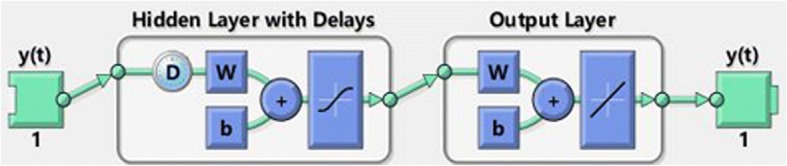
Background: Hospital crowding is a rising problem, effective predicting and detecting managment can helpful to reduce crowding. Our team has successfully proposed a hybrid model combining both the autoregressive integrated moving average (ARIMA) and the nonlinear autoregressive neural network (NARNN) models in the schistosomiasis and hand, foot, and mouth disease forecasting study. In this paper, our aim is to explore the application of the hybrid ARIMA-NARNN model to track the trends of the new admission inpatients, which provides a methodological basis for reducing crowding.
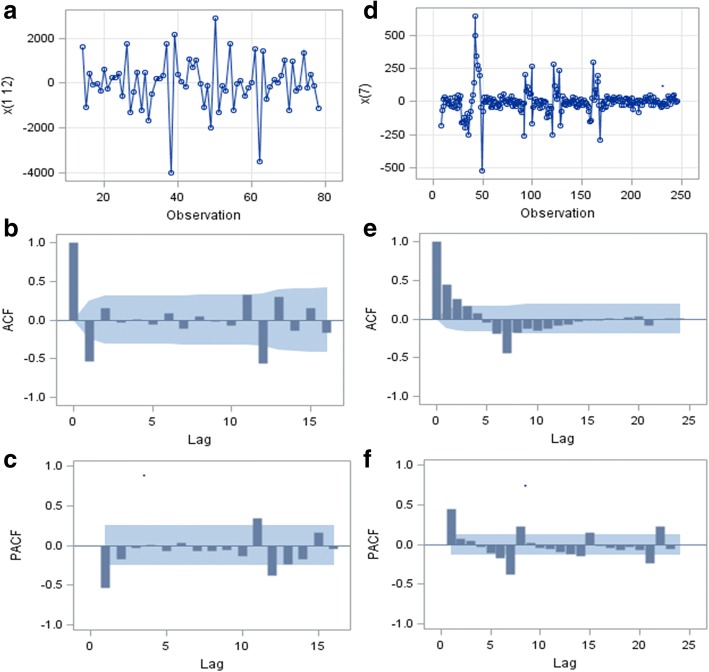
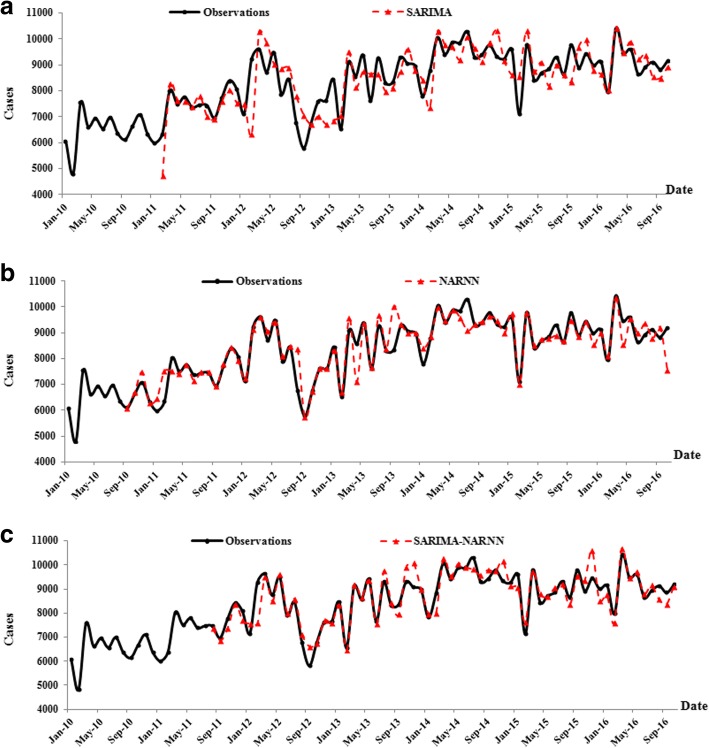
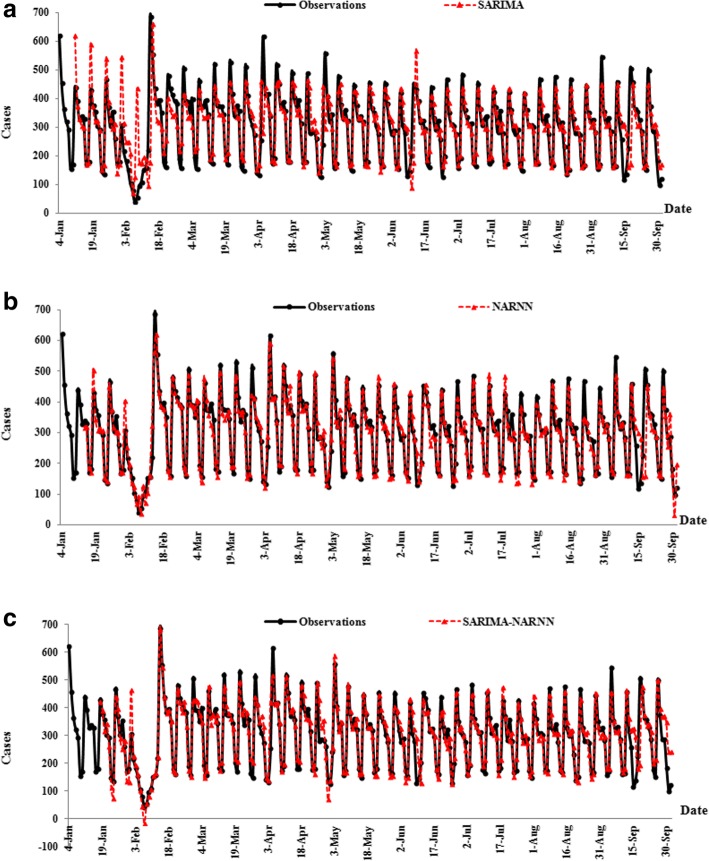
Methods: We used the single seasonal ARIMA (SARIMA), NARNN and the hybrid SARIMA-NARNN model to fit and forecast the monthly and daily number of new admission inpatients. The root mean square error (RMSE), mean absolute error (MAE) and mean absolute percentage error (MAPE) were used to compare the forecasting performance among the three models. The modeling time range of monthly data included was from January 2010 to June 2016, July to October 2016 as the corresponding testing data set. The daily modeling data set was from January 4 to September 4, 2016, while the testing time range included was from September 5 to October 2, 2016.
Results: For the monthly data, the modeling RMSE and the testing RMSE, MAE and MAPE of SARIMA-NARNN model were less than those obtained from the single SARIMA or NARNN model, but the MAE and MAPE of modeling performance of SARIMA-NARNN model did not improve. For the daily data, all RMSE, MAE and MAPE of NARNN model were the lowest both in modeling stage and testing stage.
Conclusions: Hybrid model does not necessarily outperform its constituents' performances. It is worth attempting to explore the reliable model to forecast the number of new admission inpatients from different data.
Keywords: Hybrid model; NARNN model; New admission inpatients; SARIMA model; Time series forecasting.
Conflict of interest statement
Ethics approval and consent to participate
This study was approved by the Daping Hospital of Army Military Medical University. Informed consent was waived because this research did not involve individual data.
Competing interests
The authors declare that they have no competing interests.
Publisher’s Note
Springer Nature remains neutral with regard to jurisdictional claims in published maps and institutional affiliations.
Figures


Similar articles
-
Using a Hybrid Model to Forecast the Prevalence of Schistosomiasis in Humans.Int J Environ Res Public Health. 2016 Mar 23;13(4):355. doi: 10.3390/ijerph13040355. Int J Environ Res Public Health. 2016. PMID: 27023573 Free PMC article.
-
[Prediction of schistosomiasis infection rates of population based on ARIMA-NARNN model].Zhongguo Xue Xi Chong Bing Fang Zhi Za Zhi. 2016 Jul 12;28(6):630-634. doi: 10.16250/j.32.1374.2016089. Zhongguo Xue Xi Chong Bing Fang Zhi Za Zhi. 2016. PMID: 29469251 Chinese.
-
A hybrid model for predicting the prevalence of schistosomiasis in humans of Qianjiang City, China.PLoS One. 2014 Aug 13;9(8):e104875. doi: 10.1371/journal.pone.0104875. eCollection 2014. PLoS One. 2014. PMID: 25119882 Free PMC article.
-
Autoregressive models in environmental forecasting time series: a theoretical and application review.Environ Sci Pollut Res Int. 2023 Feb;30(8):19617-19641. doi: 10.1007/s11356-023-25148-9. Epub 2023 Jan 17. Environ Sci Pollut Res Int. 2023. PMID: 36648728 Free PMC article. Review.
-
Forecasting tuberculosis incidence: a review of time series and machine learning models for prediction and eradication strategies.Int J Environ Health Res. 2024 Jun 25:1-16. doi: 10.1080/09603123.2024.2368137. Online ahead of print. Int J Environ Health Res. 2024. PMID: 38916208 Review.
Cited by
-
Predicting hospital outpatient volume using XGBoost: a machine learning approach.Sci Rep. 2025 May 16;15(1):17028. doi: 10.1038/s41598-025-01265-y. Sci Rep. 2025. PMID: 40379678 Free PMC article.
-
Time series modeling of pertussis incidence in China from 2004 to 2018 with a novel wavelet based SARIMA-NAR hybrid model.PLoS One. 2018 Dec 26;13(12):e0208404. doi: 10.1371/journal.pone.0208404. eCollection 2018. PLoS One. 2018. PMID: 30586416 Free PMC article.
-
Seasonality and trend prediction of scarlet fever incidence in mainland China from 2004 to 2018 using a hybrid SARIMA-NARX model.PeerJ. 2019 Jan 17;7:e6165. doi: 10.7717/peerj.6165. eCollection 2019. PeerJ. 2019. PMID: 30671295 Free PMC article.
-
Forecasting daily emergency department arrivals using high-dimensional multivariate data: a feature selection approach.BMC Med Inform Decis Mak. 2022 May 17;22(1):134. doi: 10.1186/s12911-022-01878-7. BMC Med Inform Decis Mak. 2022. PMID: 35581648 Free PMC article.
-
Forecasting COVID-19 Hospital Census: A Multivariate Time-Series Model Based on Local Infection Incidence.JMIR Public Health Surveill. 2021 Aug 4;7(8):e28195. doi: 10.2196/28195. JMIR Public Health Surveill. 2021. PMID: 34346897 Free PMC article.
References
MeSH terms
LinkOut - more resources
Full Text Sources
Other Literature Sources
