Metabolic model-based analysis of the emergence of bacterial cross-feeding via extensive gene loss
- PMID: 29907104
- PMCID: PMC6003207
- DOI: 10.1186/s12918-018-0588-4
Metabolic model-based analysis of the emergence of bacterial cross-feeding via extensive gene loss
Abstract
Background: Metabolic dependencies between microbial species have a significant impact on the assembly and activity of microbial communities. However, the evolutionary origins of such dependencies and the impact of metabolic and genomic architecture on their emergence are not clear.
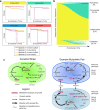
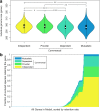
Results: To address these questions, we developed a novel framework, coupling a reductive evolution model with a multi-species genome-scale metabolic model to simulate the evolution of two-species microbial communities. Simulating thousands of independent evolutionary trajectories, we surprisingly found that under certain environmental and evolutionary settings metabolic dependencies emerged frequently even though our model does not include explicit selection for cooperation. Evolved dependencies involved cross-feeding of a diverse set of metabolites, reflecting constraints imposed by metabolic network architecture. We additionally found metabolic 'missed opportunities', wherein species failed to capitalize on metabolites made available by their partners. Examining the genes deleted in each evolutionary trajectory and the deletion timing further revealed both genome-wide properties and specific metabolic mechanisms associated with species interaction.
Conclusion: Our findings provide insight into the evolution of cooperative interaction among microbial species and a unique view into the way such relationships emerge.
Conflict of interest statement
Ethics approval and consent to participate
Not applicable.
Competing interests
The authors declare that they have no competing interests.
Publisher’s Note
Springer Nature remains neutral with regard to jurisdictional claims in published maps and institutional affiliations.
Figures


Similar articles
-
Evolutionary assembly patterns of prokaryotic genomes.Genome Res. 2016 Jun;26(6):826-33. doi: 10.1101/gr.200097.115. Epub 2016 Apr 14. Genome Res. 2016. PMID: 27197212 Free PMC article.
-
Emergence of microbial diversity due to cross-feeding interactions in a spatial model of gut microbial metabolism.BMC Syst Biol. 2017 May 16;11(1):56. doi: 10.1186/s12918-017-0430-4. BMC Syst Biol. 2017. PMID: 28511646 Free PMC article.
-
Ecology and evolution of metabolic cross-feeding interactions in bacteria.Nat Prod Rep. 2018 May 1;35(5):455-488. doi: 10.1039/c8np00009c. Epub 2018 May 25. Nat Prod Rep. 2018. PMID: 29799048 Review.
-
NetCooperate: a network-based tool for inferring host-microbe and microbe-microbe cooperation.BMC Bioinformatics. 2015 May 17;16(1):164. doi: 10.1186/s12859-015-0588-y. BMC Bioinformatics. 2015. PMID: 25980407 Free PMC article.
-
Reconstruction of microbial transcriptional regulatory networks.Curr Opin Biotechnol. 2004 Feb;15(1):70-7. doi: 10.1016/j.copbio.2003.11.002. Curr Opin Biotechnol. 2004. PMID: 15102470 Review.
Cited by
-
Bottom-Up Approaches to Synthetic Cooperation in Microbial Communities.Life (Basel). 2019 Feb 26;9(1):22. doi: 10.3390/life9010022. Life (Basel). 2019. PMID: 30813538 Free PMC article. Review.
-
Diversity begets diversity during community assembly until ecological limits impose a diversity ceiling.Mol Ecol. 2021 Nov;30(22):5874-5887. doi: 10.1111/mec.16161. Epub 2021 Sep 22. Mol Ecol. 2021. PMID: 34478597 Free PMC article.
-
Simulating the evolutionary trajectories of metabolic pathways for insect symbionts in the genus Sodalis.Microb Genom. 2020 Jul;6(7):mgen000378. doi: 10.1099/mgen.0.000378. Epub 2020 Jun 15. Microb Genom. 2020. PMID: 32543366 Free PMC article.
-
Multi-faceted approaches to discovering and predicting microbial nutritional interactions.Curr Opin Biotechnol. 2020 Apr;62:58-64. doi: 10.1016/j.copbio.2019.08.005. Epub 2019 Oct 6. Curr Opin Biotechnol. 2020. PMID: 31597114 Free PMC article. Review.
-
Syntrophy emerges spontaneously in complex metabolic systems.PLoS Comput Biol. 2019 Jul 24;15(7):e1007169. doi: 10.1371/journal.pcbi.1007169. eCollection 2019 Jul. PLoS Comput Biol. 2019. PMID: 31339876 Free PMC article.
References
-
- West SA, Diggle SP, Buckling A, Gardner A, Griffin AS. The social lives of microbes. Annu Rev Ecol Evol Syst. 2007;38:53–77. doi: 10.1146/annurev.ecolsys.38.091206.095740. - DOI
Publication types
MeSH terms
Grants and funding
LinkOut - more resources
Full Text Sources
Other Literature Sources

