Case Reports
. 2018 Aug 1;4(4):a002550.
doi: 10.1101/mcs.a002550. Print 2018 Aug.

Clinical response of the novel activating ALK-I1171T mutation in neuroblastoma to the ALK inhibitor ceritinib

Affiliations
Case Reports

Clinical response of the novel activating ALK-I1171T mutation in neuroblastoma to the ALK inhibitor ceritinib

Jikui Guan et al. Cold Spring Harb Mol Case Stud. .

Abstract

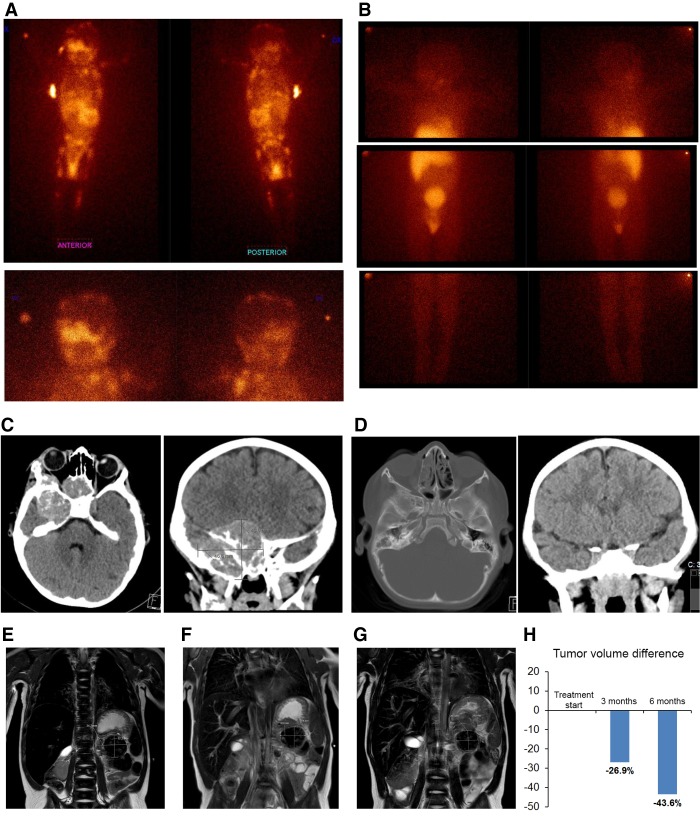
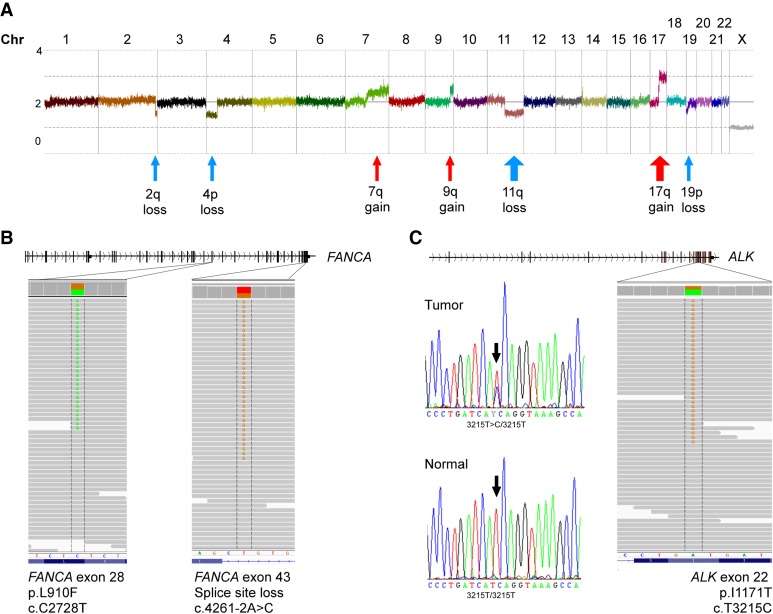
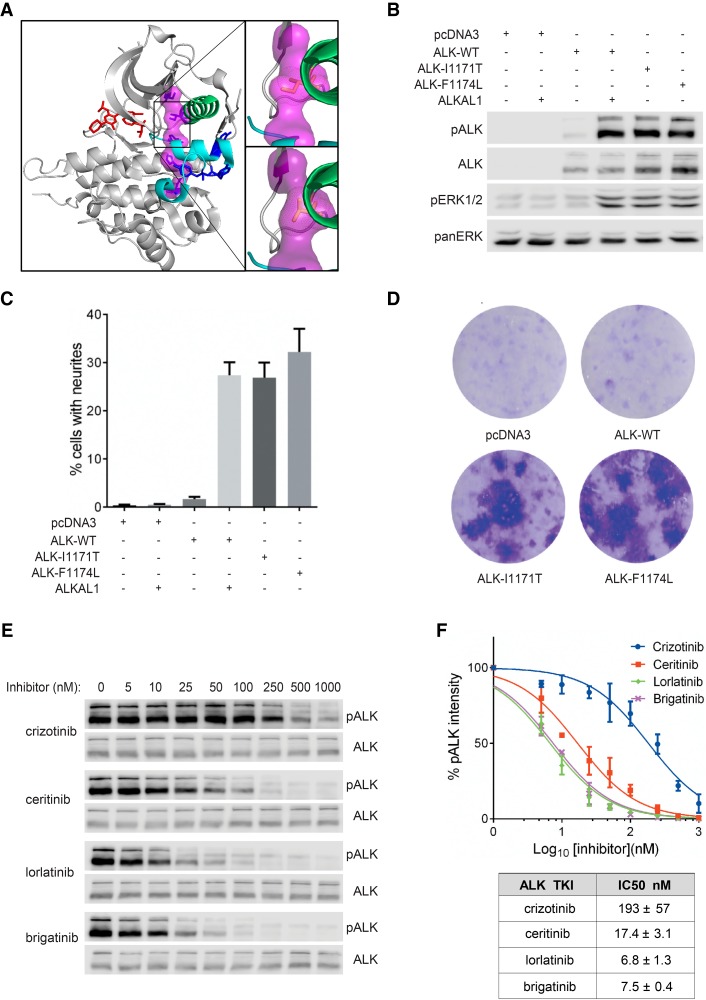
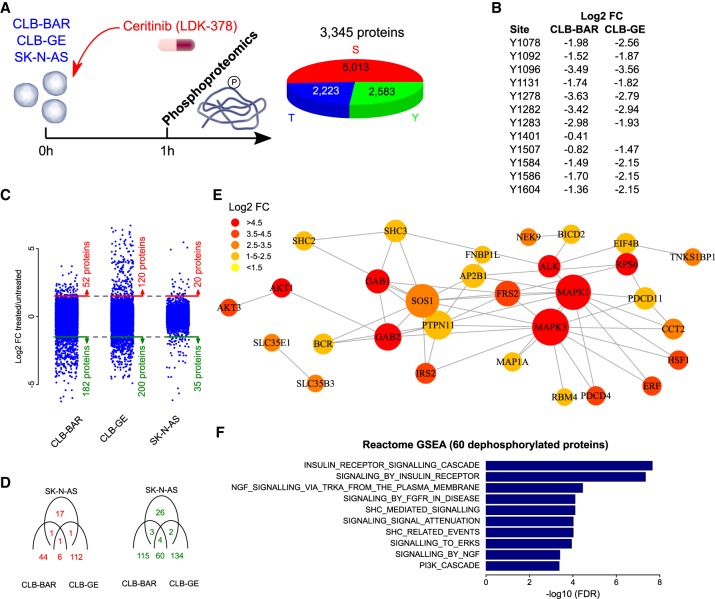
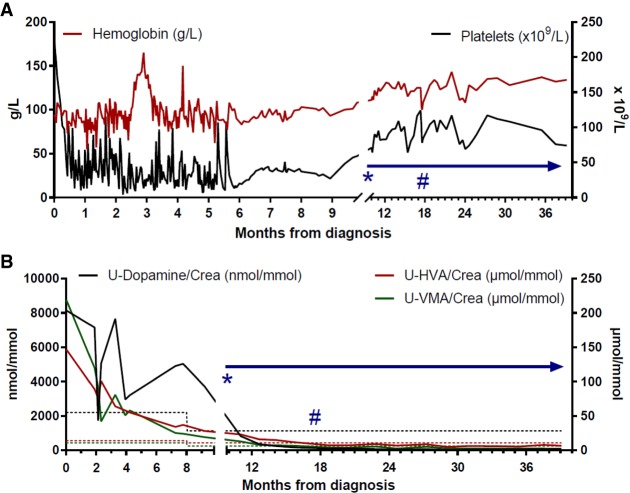
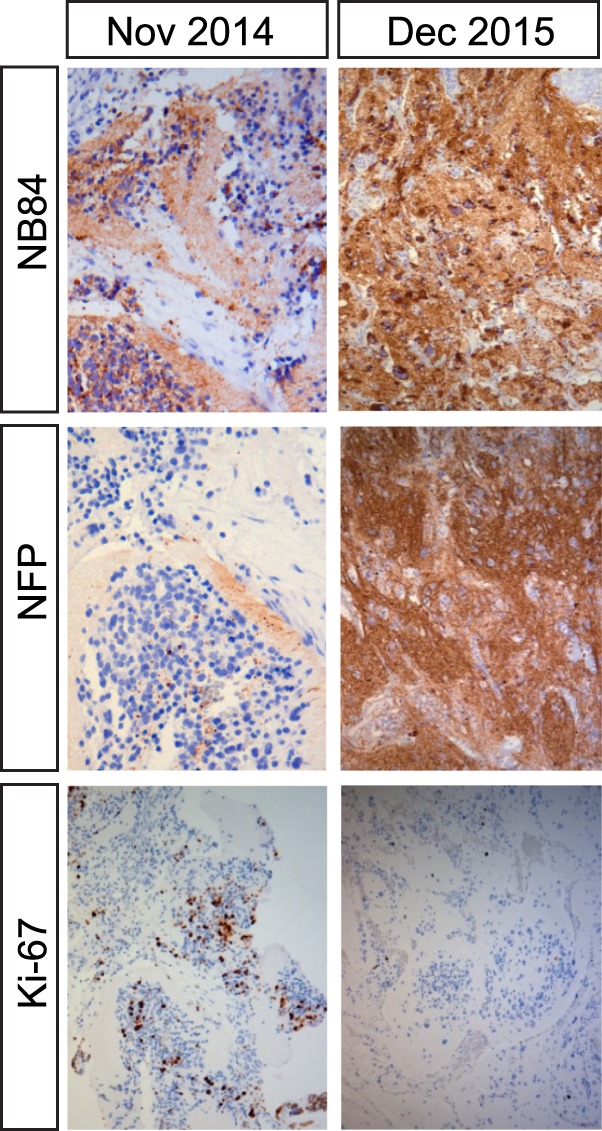
Tumors with anaplastic lymphoma kinase (ALK) fusion rearrangements, including non-small-cell lung cancer and anaplastic large cell lymphoma, are highly sensitive to ALK tyrosine kinase inhibitors (TKIs), underscoring the notion that such cancers are addicted to ALK activity. Although mutations in ALK are heavily implicated in childhood neuroblastoma, response to the ALK TKI crizotinib has been disappointing. Embryonal tumors in patients with DNA repair defects such as Fanconi anemia (FA) often have a poor prognosis, because of lack of therapeutic options. Here we report a child with underlying FA and ALK mutant high-risk neuroblastoma responding strongly to precision therapy with the ALK TKI ceritinib. Conventional chemotherapy treatment caused severe, life-threatening toxicity. Genomic analysis of the initial biopsy identified germline FANCA mutations as well as a novel ALK-I1171T variant. ALK-I1171T generates a potent gain-of-function mutant, as measured in PC12 cell neurite outgrowth and NIH3T3 transformation. Pharmacological inhibition profiling of ALK-I1171T in response to various ALK TKIs identified an 11-fold improved inhibition of ALK-I1171T with ceritinib when compared with crizotinib. Immunoaffinity-coupled LC-MS/MS phosphoproteomics analysis indicated a decrease in ALK signaling in response to ceritinib. Ceritinib was therefore selected for treatment in this child. Monotherapy with ceritinib was well tolerated and resulted in normalized catecholamine markers and tumor shrinkage. After 7.5 mo treatment, the residual primary tumor shrunk, was surgically removed, and exhibited hallmarks of differentiation together with reduced Ki67 levels. Clinical follow-up after 21 mo treatment revealed complete clinical remission including all metastatic sites. Therefore, ceritinib presents a viable therapeutic option for ALK-positive neuroblastoma.

Keywords: abnormality of the enteric ganglia; anaplastic large-cell lymphoma; neuroblastoma.


Figures

Figure 1.
Figure 1.
Patient tumor imaging. Disease at initial diagnosis and after targeted therapy in full clinical remission (AD). (A) Whole-body MIBG-I123 scintigraphy showing extensive metastatic disease at diagnosis of high-risk neuroblastoma (upper panels). (Left panel) anterior view; (right panel) posterior view. Lower panels display head and neck region. (B) MIBG-scintigraphy after 21 mo of ceritinib therapy showing complete remission at all metastatic sites. (C) Brain CT scans at diagnosis showing a CNS metastasis (43 mm × 46.7 mm) posterior to the right orbit. (D) CT scans after 21 mo of ceritinib therapy showing complete metastatic response. (EH) Primary tumor immediately before and after targeted therapy. (E) Magnetic resonance imaging (MRI) of primary abdominal tumor (indicated by arrows and measurements inserted) immediately before start of ceritinib targeted therapy (∼18.8 mL tumor volume), (F) MRI after 3 mo therapy (∼13.8 mL tumor volume), and (G) MRI after 6 mo therapy immediately prior to radical surgery (∼10.6 mL tumor volume). (H) Decrease of evaluable tumor volume after 3 and 6 mo of targeted therapy.
Figure 2.
Figure 2.
Genomic analysis of the tumor sample. (A) Copy number profiling using Affymetrix HD SNP-microarray shows a genomic profile with 11q-deletion and 17q-gain indicative of high-risk neuroblastoma. (B) Two different likely pathogenic variants in the FANCA gene were detected through exome sequencing and confirmed in constitutional DNA of the patient. Read mapping is visualized in IGV. (C) Exome sequencing also detected a novel ALK I1171T mutation in the tumor that was confirmed to be somatic through Sanger sequencing. Electrophorogram of tumor in upper panel and from constitutional DNA in lower panel.
Figure 3.
Figure 3.
Characterization of ALK-I1171T with cell culture systems. (A) Model of the ALK kinase domain (PDB #3LCS) using PyMol, which can be divided into the upper amino-terminal lobe and the lower carboxy-terminal lobe by the hinge region and ceritinib binding/ATP (red) binding pocket. Regulatory spine (R-spine) residues are shown in magenta. The spine is anchored in the αF-helix (D1311) and includes the DFG (F1271) and the HRD motif (H1247) of the C-lobe. R-spine residues in the amino-terminal lobe include the β4 strand (C1182) and the residue mutated in this patient in the αC-helix (I1171). Mutation of residue I1171 to threonine in PyMol, results in a small shift, which potentially drives a dynamic allostery that results in a gain-of-function ALK activity (upper insert: wild-type ALK kinase domain; lower insert: ALK-I1171T kinase domain). (B) ALK kinase activity and activation of downstream signaling pathways were visualized by western blot with antibodies against pALK (Y1604) and pERK1/2. Total ALK and pan-ERK were used as loading controls. Blots are representative of three independent experiments. (C) Neurite outgrowth of PC12 cells as a readout for ALK kinase activity was performed with wild-type ALK and ALK variants in the absence or presence of ALKAL1 ligand. Bars represent mean percentage ± STD of neurite-carrying cells among GFP-positive cells from three independent experiments. (D) Representative focus formation assays for NIH 3T3 cells transfected with wild-type ALK, ALK variants (ALK-I1171T and ALK-F1174L), or empty vector. (E) Inhibition profiling of ALK TKIs on ALK-I1171T. PC12 cells expressing ALK-I1171T were treated with serial dilution of ALK inhibitors as indicated. Phosphorylation of ALK was detected with pALK (Y1604) antibody and total ALK was used as loading control. (F) IC50 values of different ALK inhibitors were calculated with GraphPad Prism 6.0 by fitting data to a log (inhibitor concentration) versus normalized response (variable slope) equation and shown in the accompanying table. Values represent average ± STD from three independent experiments.
Figure 4.
Figure 4.
Ceritinib phosphoproteomic profile in neuroblastoma cell lines. (A) Three neuroblastoma cell lines (CLB-BAR, CLB-GE, and SK-N-AS) were cultured in control conditions or in the presence of ceritinib. Cells were harvested for tyrosine and serine/threonine phosphoproteomic analysis after 60 min. The pie chart indicates the number of targeted sites. (B) Overview of all ALK tyrosine phosphorylation sites with log2 fold change values (FC; treated/untreated) in CLB-BAR and CLB-GE. Note that no signal was measured in SK-N-AS cells, reflecting the known absent expression of ALK. (C) Log2 FC values of all analyzed phosphosites indicating the number of proteins found to contain phosphorylated (red) or dephosphorylated (green) sites for the three cell lines analyzed. Dotted lines indicate thresholds to determine differential phosphorylation. (D) Venn diagrams show the correlation between phosphorylated (red) and dephosphorylated (green) proteins in the different cell lines. Sixty proteins were found to be dephosphorylated upon ceritinib treatment in the ALK-addicted CLB-BAR and CLB-GE lines but not in the SK-N-AS cell line. (E) These proteins were mapped to the InWeb_ InBioMap protein–protein interaction network. For visualization purposes, only direct interactions between the identified proteins are shown. Node sizes are proportional to the number of connections, whereas node colors indicate different log2 FC values as indicated in the color scale legend on the top left. (F) Reactome gene set enrichment analysis on all 60 proteins that were identified to be dephosphorylated. The 10 most significantly enriched pathways are shown and ranked on FDR values.
Figure 5.
Figure 5.
Hematological counts and catecholamine metabolites in urine. (A) After conventional high-risk neuroblastoma chemotherapy was started, the patient suffered severe bone marrow toxicity with protracted anemia and thrombocytopenia requiring frequent transfusions (each peak indicates posttransfusion measurement). When hematological counts stabilized, ceritinib treatment could be started (*). Hemoglobin and platelet counts remained stable during TKI treatment, allowing for surgery (#) with radical removal of the differentiated and calcified decreased primary tumor. (B) Catecholamine metabolites (dopamine in black, homovanillic acid [HVA] in red, and vanillylmandelic acid [VMA] in green) as neuroblastoma markers in the patient's urine (molar concentrations/creatinine concentration). During ceritinib therapy (*), elevated urine catecholamine metabolites returned to normal (below respective dashed line), indicating a biologically inactive residual tumor. At surgery (#) normal levels had been reached.
Figure 6.
Figure 6.
Immunohistochemical analysis of tumor material. Tumor sample taken in November 2014 was stroma-poor, comprising of small, round, primitive-appearing cells positive for the Ki-67 proliferation marker in up to 27%. Postceritinib treatment resected tumor displayed few Ki-67 positive cells and increased expression of NB84 and NFP, which are markers for differentiated neuroblastoma.

References

    1. Abbondanzo SL, Manz HJ, Klappenbach RS, Gootenberg JE. 1986. Hepatocellular carcinoma in an 11-year-old girl with Fanconi's anemia. Report of a case and review of the literature. Am J Pediatr Hematol Oncol 8: 334–337. - PubMed
    1. Benjamini Y, Hochberg Y. 1995. Controlling the false discovery rate: a practical and powerful approach to multiple testing. J R Stat Soc Series B Methodol 57: 289–300.
    1. Berrebi D, Lebras MN, Belarbi N, Couturier J, Fattet S, Faye A, Peuchmaur M, de Lagausie P. 2006. Bilateral adrenal neuroblastoma and nephroblastoma occurring synchronously in a child with Fanconi's anemia and VACTERL syndrome. J Pediatr Surg 41: e11–e14. - PubMed
    1. Berry T, Luther W, Bhatnagar N, Jamin Y, Poon E, Sanda T, Pei D, Sharma B, Vetharoy WR, Hallsworth A, et al. 2012. The ALK(F1174L) mutation potentiates the oncogenic activity of MYCN in neuroblastoma. Cancer Cell 22: 117–130. - PMC - PubMed
    1. Bissig H, Staehelin F, Tolnay M, Avoledo P, Richter J, Betts D, Bruder E, Kühne T. 2002. Co-occurrence of neuroblastoma and nephroblastoma in an infant with Fanconi's anemia. Hum Pathol 33: 1047–1051. - PubMed

Publication types

MeSH terms

LinkOut - more resources