. 2018 Aug;28(8):1193-1206.
doi: 10.1101/gr.233049.117. Epub 2018 Jun 15.

A modular dCas9-SunTag DNMT3A epigenome editing system overcomes pervasive off-target activity of direct fusion dCas9-DNMT3A constructs

Affiliations

A modular dCas9-SunTag DNMT3A epigenome editing system overcomes pervasive off-target activity of direct fusion dCas9-DNMT3A constructs

Christian Pflueger et al. Genome Res. 2018 Aug.

Abstract

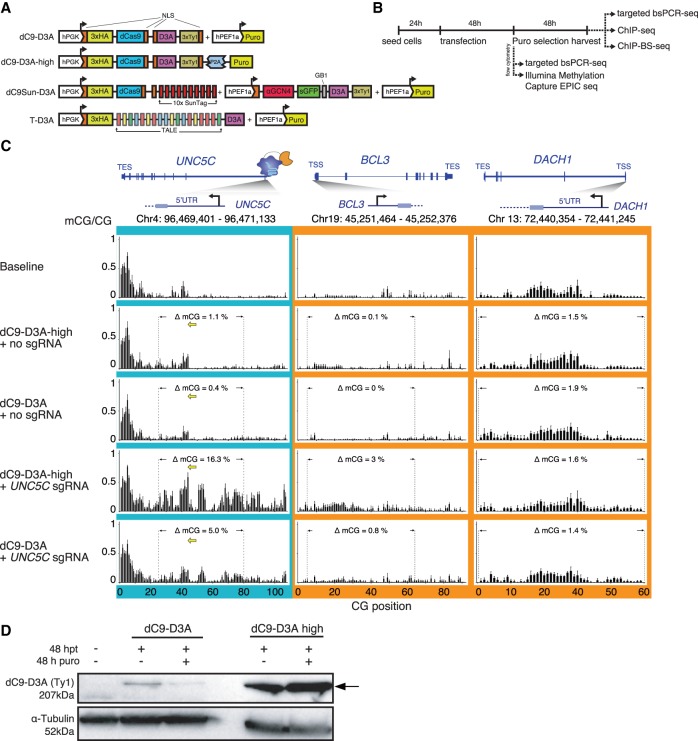
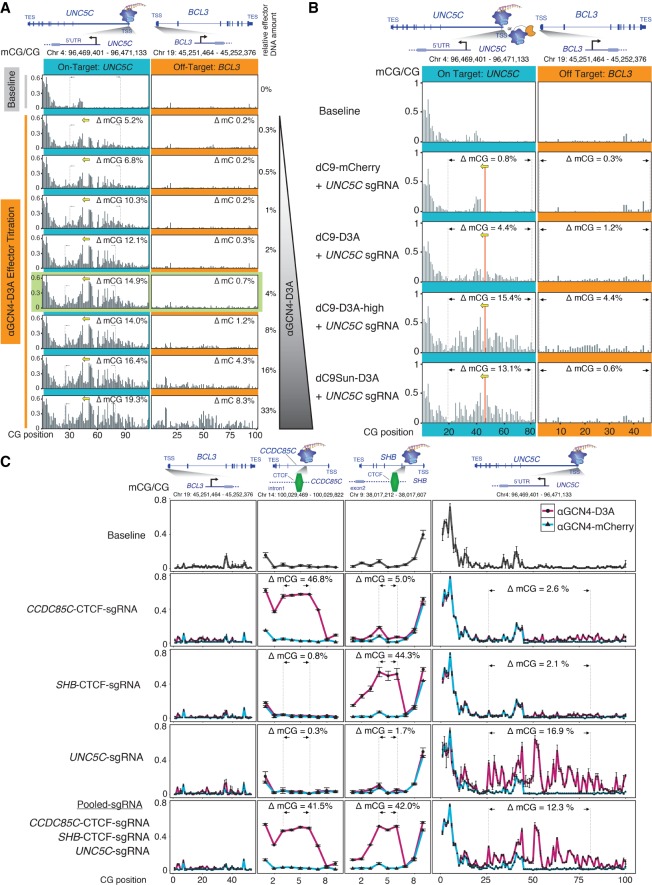
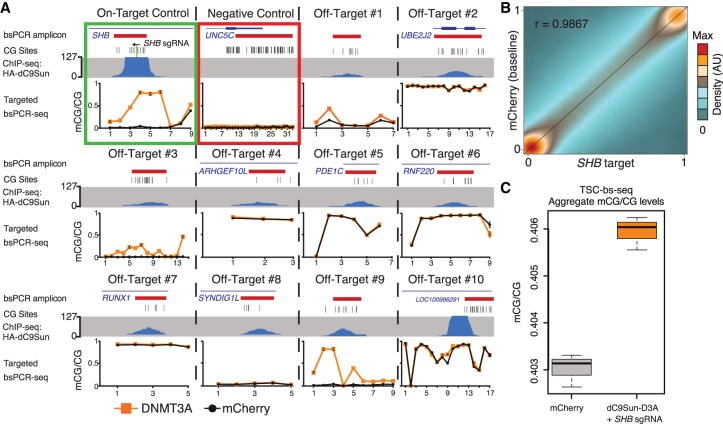
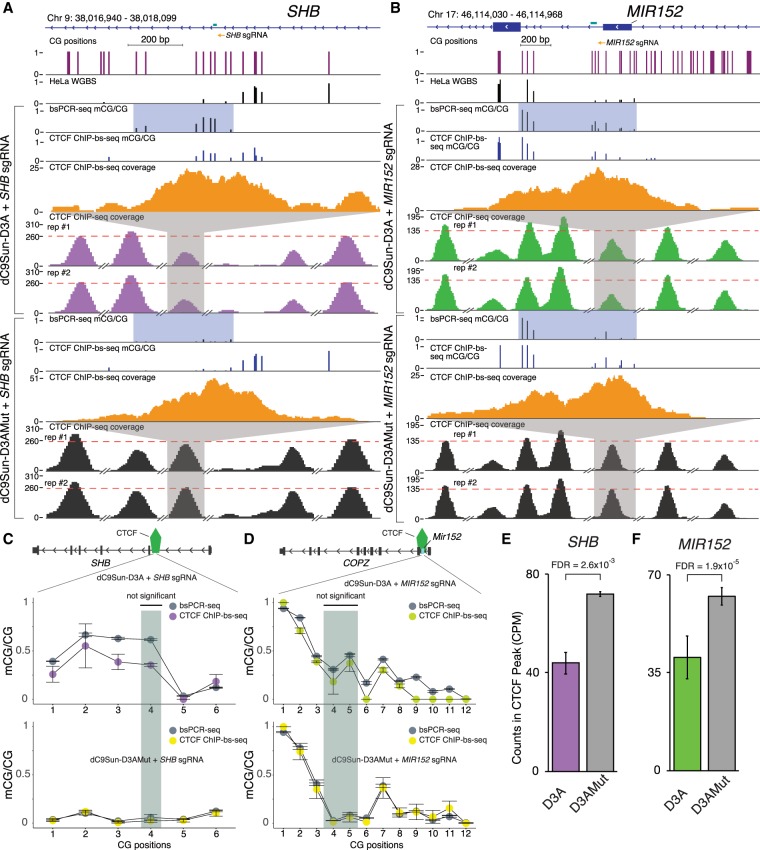
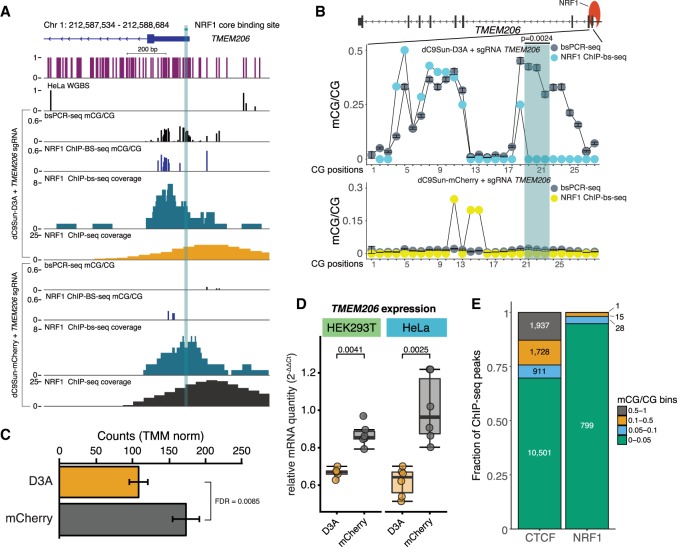
Detection of DNA methylation in the genome has been possible for decades; however, the ability to deliberately and specifically manipulate local DNA methylation states in the genome has been extremely limited. Consequently, this has impeded our understanding of the direct effect of DNA methylation on transcriptional regulation and transcription factor binding in the native chromatin context. Thus, highly specific targeted epigenome editing tools are needed to address this. Recent adaptations of genome editing technologies, including fusion of the DNMT3A DNA methyltransferase catalytic domain to catalytically inactive Cas9 (dC9-D3A), have aimed to alter DNA methylation at desired loci. Here, we show that these tools exhibit consistent off-target DNA methylation deposition in the genome, limiting their capabilities to unambiguously assess the functional consequences of DNA methylation. To address this, we developed a modular dCas9-SunTag (dC9Sun-D3A) system that can recruit multiple DNMT3A catalytic domains to a target site for editing DNA methylation. dC9Sun-D3A is tunable, specific, and exhibits much higher induction of DNA methylation at target sites than the dC9-D3A direct fusion protein. Importantly, genome-wide characterization of dC9Sun-D3A binding sites and DNA methylation revealed minimal off-target protein binding and induction of DNA methylation with dC9Sun-D3A, compared to pervasive off-target methylation by dC9-D3A. Furthermore, we used dC9Sun-D3A to demonstrate the binding sensitivity to DNA methylation for CTCF and NRF1 in situ. Overall, this modular dC9Sun-D3A system enables precise DNA methylation deposition with the lowest off-target DNA methylation levels reported to date, allowing accurate functional determination of the role of DNA methylation at single loci.


Figures

Figure 1.
Figure 1.
Characterizing on-target and off-target mCG deposition efficiency by dC9-D3A direct fusion system. (A) Schematics of the dCas9 (dC9) and TALE (T) constructs used, indicating positioning of nuclear localization sequences (NLS), protein tags (human influenza hemagglutinin [3xHA, 3xTy1]), promoter choice (glycerol kinase promoter [hPGK], human elongation factor-1 alpha promoter [hPEF1a]), solubility tag (protein G B1 domain [GB1]), selectable marker (puromycin resistance [puro]), single-chain Fv antibody against GCN4 domain (αGCN4), and human DNTM3A catalytic domain (D3A). (B) Timeline and outline for experimental design for measuring DNA methylation and TF occupancy (CTCF and NRF1). (C) Targeted DNA methylation deposition to the UNC5C promoter in HeLa cells, measured by bsPCR-seq. sgRNA placement is shown with yellow arrows; dotted lines indicate interval for CGs included in quantitation. (D) Western blot of relative dC9-D3A protein abundance (anti-Ty1) per 50 µg of total cell lysate: (lane 1) untransfected HeLa cells, (lanes 2,4) 48 h post transfection (hpt), (lanes 3,5) 48 hpt and 48 h puromycin (puro) selection, loading control anti-Tubulin. Arrow indicates dC9-D3A.
Figure 2.
Figure 2.
Modular dC9Sun-D3A system outperforms dC9-D3A direct fusion. (A) Titration of αGCN4-D3A effector (D3A [human DNMT3A catalytic domain]). Fraction of mCG is shown in black bars; dotted lines and black arrows indicate region used to calculate mCG change. (B) Comparison of dC9-D3A high, dC9-D3A, dC9Sun-D3A, and dC9Sun-mCherry (CRISPRi control) at the UNC5C promoter (on-target) versus the BCL3 promoter (off-target) by targeted bsPCR-seq (average mCG/CG, n = 3 replicates; error bars, SD). (C) mCG deposition efficiency by dC9Sun-D3A at three different loci (CCDC85C, SHB, and UNC5C promoters) measured by targeted bsPCR-seq (average mCG/CG, n = 3 replicates; error bars, SD).
Figure 3.
Figure 3.
Genome-wide off-target DNA methylation assessment. (A) Compilation of dC9Sun-D3A ChIP-seq (blue peaks) and targeted bsPCR-seq for CGs covered by ChIP-seq (bsPCR amplicon location in red), bsPCR-seq mCherry-only expressing cells (black line), and SHB sgRNA + dC9Sun-D3A (orange line) (sorted cells, n = 3 biological replicates; error bars, SD). (B) Correlation of mCG values for each CG site (>2.6 × 10⁶, ≥5× coverage) of combined replicates (n = 3) from Illumina TruSeq methyl capture EPIC pulldown experiment. mCherry (baseline) HeLa cells shown on y-axis; SHB target dC9Sun-D3A HeLa cells shown on x-axis. Pearson correlation coefficient shown in upper left corner. (C) Boxplot of mCG/CG from all covered CGs from mCherry only HeLa cells (gray) and SHB sgRNA + dC9Sun-D3A (orange) (n = 3 biological replicates; thick black line indicates median; error bars, SD).
Figure 4.
Figure 4.
Impact of targeted DNA methylation induction on CTCF binding. (A) Genome Browser display of targeted CTCF binding site in an SHB intron. Sets of experiments include (from top to bottom): targeted bsPCR-seq (fraction mCG/CG), CTCF-ChIP-bs-seq (fraction mCG/CG), CTCF-ChIP-bs-seq coverage, and CTCF ChIP-seq coverage. CTCF core binding site is highlighted in shaded green. CTCF ChIP-seq coverage (TMM normalized counts) is shown with adjacent peaks for reference (broken x-axis). Red dotted line is set to maximum targeted CTCF peak in the control samples. (B) Genome Browser snapshot of targeted CTCF binding site upstream of MIR152. (C,D) Quantitation of mCG/CG in CTCF core binding site (green shaded region) and adjacent to core binding site comparing targeted bsPCR-seq (gray circles) to ChIP-bs-seq (purple or green circles for αGCN4-D3A and yellow circles for αGCN4-D3AMut) for SHB and MIR152, respectively (replicates n = 2; error bars, SD; Fisher's exact test). (E,F) Quantitation of CTCF CPM normalized ChIP-seq peak at SHB and MIR152, respectively (replicates n = 2; error bars, SD; statistic edgeR, Benjamini-Hochberg multiple test corrected P-values).
Figure 5.
Figure 5.
Impact of targeted DNA methylation induction on NRF1 binding. (A) Genome Browser display of the targeted NRF1 binding site in the TMEM206 promoter. Sets of experiments include (from top to bottom): bsPCR-seq (mCG/CG), NRF1-ChIP-bs-seq (mCG/CG), NRF1-ChIP-bs-seq coverage, and NRF1 ChIP-seq-coverage. The NRF1 core binding site is highlighted in shaded green. (B) Quantitation of mCG/CG in the NRF1 core binding site (green shaded region) and adjacent to core binding site, comparing targeted bsPCR-seq (gray circles) to ChIP-bs-seq (cyan circles for αGCN4-DNMT3A and yellow circles for αGCN4-mCherry) at the TMEM206 promoter (NRF1 ChIP-bs samples combined n = 3 for coverage; bsPCR-seq, n = 3; error bars, SD; statistic: Fisher's exact test). (C) Quantitation of the TMEM206 promoter NRF1 ChIP-seq peak counts (TMM normalized) in samples treated with αGCN4-D3A (orange) compared to αGCN4-mCherry (gray) (mCherry n = 2; D3A n = 3; statistic edgeR, Benjamini-Hochberg multiple test corrected P-values). (D) qRT-PCR analysis of TMEM206 expression (normalized to geometric mean of the housekeeping genes RPS18, GAPDH, and HSPC3) comparing dC9Sun-D3A and dC9Sun-mCherry targeted to the NRF1 binding site in the TMEM206 promoter. Cells tested are HEK293T and HeLa cells, respectively (biological replicates n = 6; reference GFP-Puro transfected, puromycin-treated HeLa or HEK293T cells n = 4; statistic: Wilcoxon/Mann-Whitney U test, one-tailed). (E) Comparison of average mCG/CG in the CTCF and NRF1 core binding sites, respectively, by binning them into intervals of no (≥0 and ≤0.05), low (>0.05 and ≤0.1), intermediate (>0.1 and ≤0.5), or high (>0.5) levels of DNA methylation.

Similar articles

Cited by

References

    1. Allhoff M, Seré K, F Pires J, Zenke M, G Costa I. 2016. Differential peak calling of ChIP-seq signals with replicates with THOR. Nucleic Acids Res 44: e153. - PMC - PubMed
    1. Amabile A, Migliara A, Capasso P, Biffi M, Cittaro D, Naldini L, Lombardo A. 2016. Inheritable silencing of endogenous genes by hit-and-run targeted epigenetic editing. Cell 167: 219–232.e14. - PMC - PubMed
    1. Bernstein BE, Meissner A, Lander ES. 2007. The mammalian epigenome. Cell 128: 669–681. - PubMed
    1. Bernstein DL, Le Lay JE, Ruano EG, Kaestner KH. 2015. TALE-mediated epigenetic suppression of CDKN2A increases replication in human fibroblasts. J Clin Invest 125: 1998–2006. - PMC - PubMed
    1. Bolger AM, Lohse M, Usadel B. 2014. Trimmomatic: a flexible trimmer for Illumina sequence data. Bioinformatics 30: 2114–2120. - PMC - PubMed

Publication types

Substances